
The TRUMP token has seen fluctuations in its price, highlighting its inherent volatility and the unpredictable nature of the market. Priced at $27.39, the token has experienced a 5.30% drop over the last 24 hours, following a peak above $29 earlier in the day.
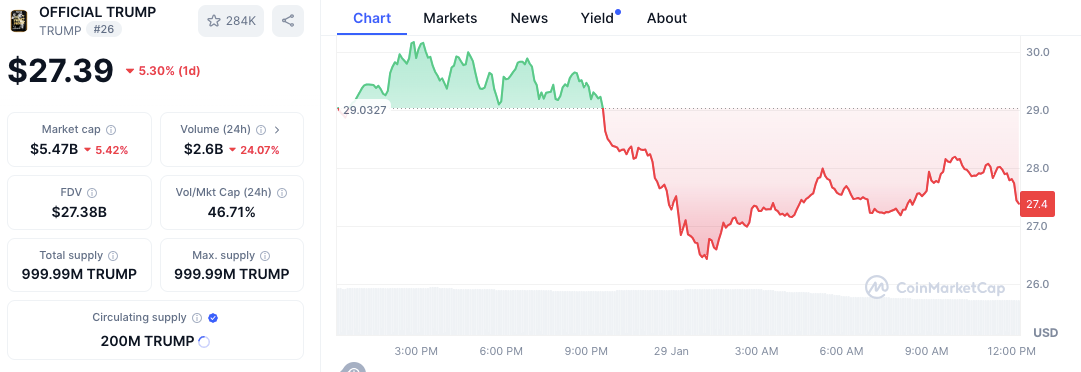
With a market cap of $5.47 billion and a 24-hour trading volume of $2.6 billion, $TRUMP has demonstrated substantial market activity despite the recent price decline. Traders are closely monitoring these movements, as the asset’s future direction remains uncertain. Many expect further volatility in the coming days.
Market trends and trading levels
Due to its recent bullish and bearish fluctuations, traders are paying close attention to the TRUMP token. With a current price of $27.39, below previous highs of $29, the most recent price activity suggests a fall.
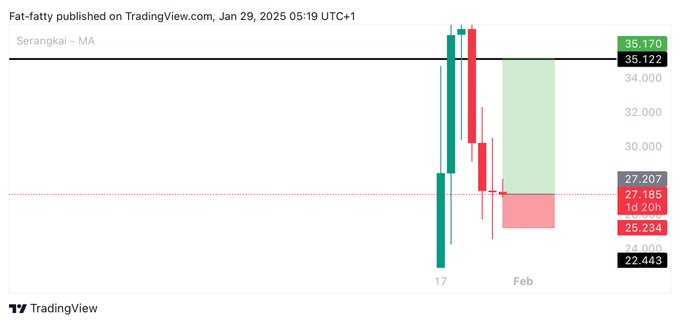
Key price levels have been established in the market. A potential resistance zone is near $35.17, while a critical support level is at $22.44. The current market sentiment suggests that traders are closely watching these zones for price rejections or possible breakthroughs.
A trading setup has been suggested, with an entry point at $27.15, targeting $35.12, and a stop-loss set at $25.145. These levels are drawn from price action, indicating areas where the token has seen both bullish and bearish behavior.
Profit and loss distribution among traders
According to Social Media Trading Analysis (SMTA) data, a large portion of traders are experiencing profits or losses within a relatively narrow range. A majority, totaling 486,421 traders, have seen minimal gains or losses, with most positions falling between a -1k and 0 profit/loss range. In contrast, around 259,429 traders are experiencing larger losses, ranging between -1k and -10k.
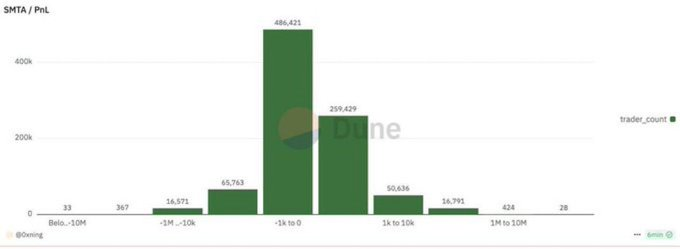
The number of traders in the extreme profit categories remains limited, with only 424 traders in the 1M to 10M profit range. This distribution highlights the high-risk, high-reward nature of trading the TRUMP token, where most traders are either holding their positions or facing moderate losses.
Technical indicators and market sentiment
Technical analysis reveals a mixed picture for TRUMP, with both the MACD and RSI indicators showing signs of bearish pressure. The RSI, currently at 44.73, suggests a neutral market, neither oversold nor overbought. This could indicate a possible continuation of the current trend or a shift towards a bearish sentiment if the token’s momentum weakens further.
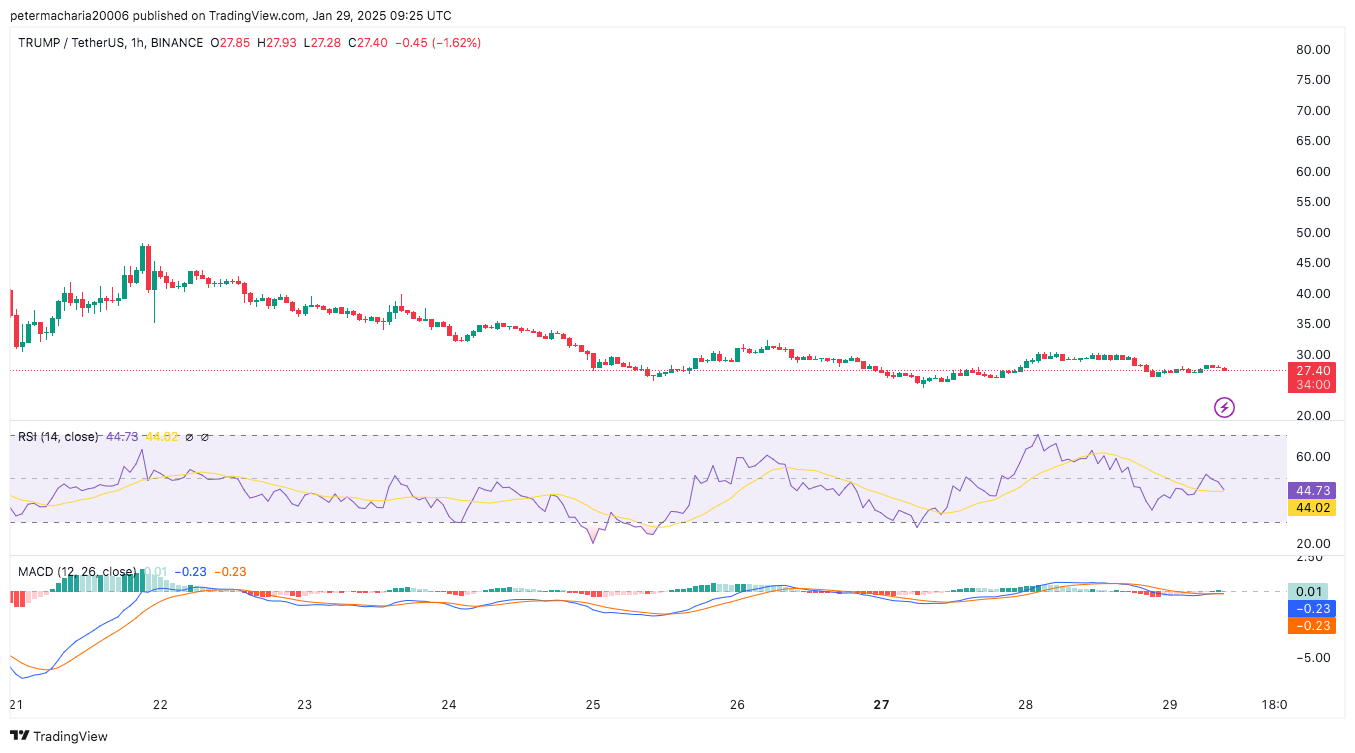
The MACD demonstrates bearish force since its lines revere one another, indicating buying momentum erosion. Traders need to stay watchful for indications of trend change because both MACD and RSI highlight successful execution. This signals potential bullish recovery signals.


