Uniswap (UNI) continues to trade close to $10, and data shows traders are assessing if the recent drop has already hit bottom. On-chain signals suggest possible signs of capitulation, indicating weaker holders may have already sold their positions.
At the time of writing, the token is trading at $9.99, showing a small daily drop of 0.27%. Its market cap stands at $6.28 billion, while the fully diluted value reaches $9.99 billion. Trading stays active with a 24-hour volume of $381.14 million, but this figure records a 7.24% fall compared with yesterday.
Market action and short-term support
Recent trading sessions show resistance above $10.10, where intraday upswings were unable to hold their ground. Buyers continue to support lower levels, mostly between $9.70 and $9.90, which are providing short-term support. Volume spikes in those ranges indicate active buying despite the failure to gain traction.
If the coin maintains this buying pressure, it may try another test of the $10.10 barrier. A close above that level can open the way toward $11–$12. On the other hand, if it fails to hold support zones, the price may drop toward $9.50, a level traders watch closely.
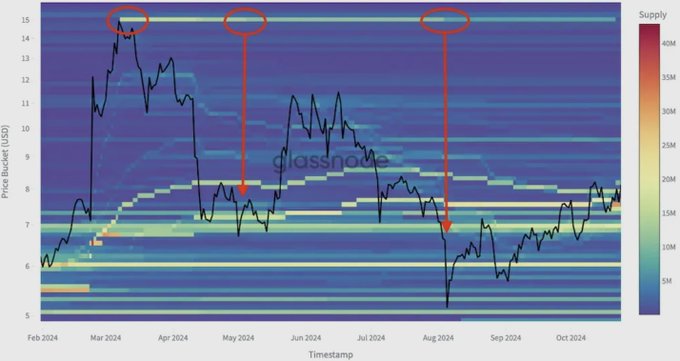
Teresa’s on-chain study shows UNI’s supply has changed. Holdings that once stayed near $15 have now spread out. During several sell-off points, weak holders dropped their tokens, and stronger investors took them. This trend looks like past areas where market bottoms often form.
Technical signals point to indecision around $9.50 support
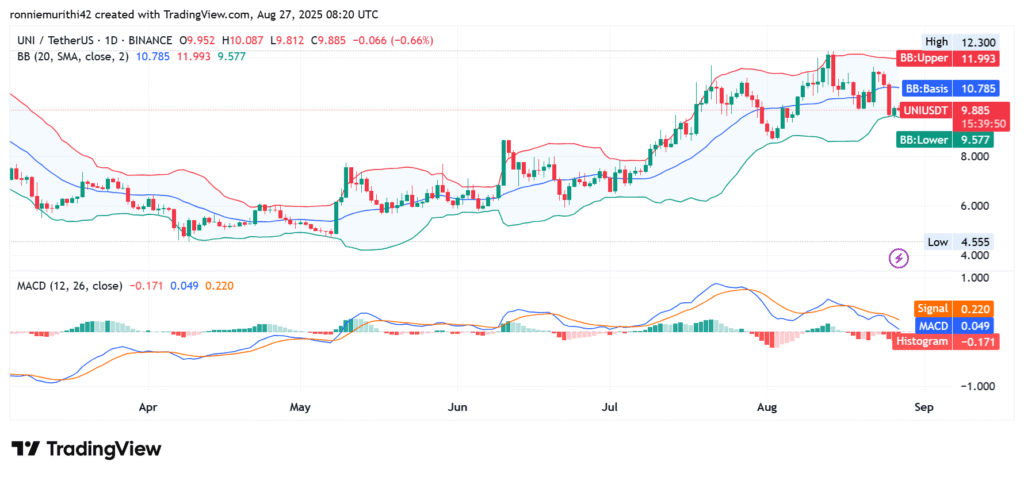
Uniswap at $11.99–$9.58 Bollinger Bands on TradingView analysis keeps the price around the baseline. The contracting range signals indecision as buyers and sellers await a signal. Significant resistance is still around $12, while $9.50 remains the key downside level.
The MACD line stays just above the signal line, but the negative histogram shows weak momentum. The recent moves near $12.30 suggest that rejection at higher levels is keeping the upside limited for now.
On-chain data shows long-term holders may support downside unless sentiment worsens. Their steady role lowers sharp drop chances, making consolidation before a likely breakout the expected near-term path.