
Dogwifhat (WIF) is trading at $0.8193 after gaining 5.43% in the past day. Even with this daily rise, the bigger picture still shows pressure on the chart. The token keeps testing key support zones as sellers stay active. Now, everyone in the market is watching closely to see if the $0.77 level can hold and stop any further drop.
In the past day, WIF dropped 12.83%, moving from $0.86 down to $0.77 before slight relief emerged. This zone is now key, as a breakdown could push the price toward $0.761. If support stays intact, bulls may try to steady momentum and set up a recovery base.
Trading volume for the previous 24 hours hit $342.5 million, recording active interest irrespective of the retracement of price. With the market cap staying at approximately $770 million, the token still commands influence among traders. Good participation means many perceive the slide as a correction, not a complete breakdown.
Bearish momentum and oversold signals define the market outlook
In the short term, the price has tested the $0.774 support level several times, and it’s still holding strong. If sellers push again, the price might dip closer to $0.761. But if the market bounces back from this level, it could climb toward $1.079, giving patient buyers a chance to catch some upside.
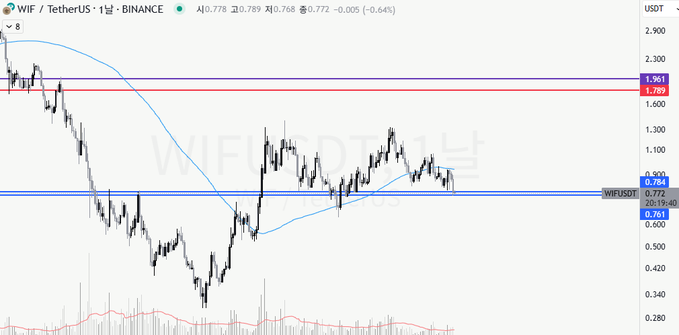
Technical patterns reveal volatile swings between $0.774 and $1.079, signaling uncertainty. The next decisive move depends heavily on volume. Without stronger participation in upward attempts, rallies remain unsustainable. A breakout above $1.079 could extend momentum toward $1.961, while weakness beneath support invites deeper losses in the coming sessions.
On the daily chart, WIF trades close to the lower Bollinger Band at $0.767. This area usually points to oversold conditions and possible rebounds. That could bring short-term relief, but the overall trend still looks bearish until stronger signals show up in indicators and market activity.
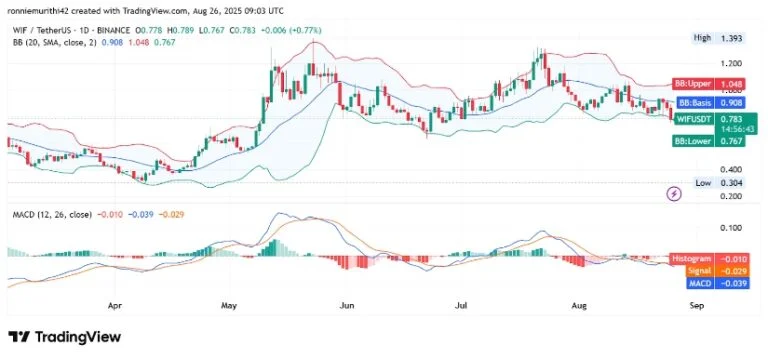
Bearish momentum remains intact as the MACD line stays under the signal line and the histogram holds in negative territory, signaling persistent selling pressure. Traders view this as evidence of sustained downside bias, with any short-term rebounds requiring strong confirmation before a recovery outlook can emerge.