Dogecoin is showing price patterns similar to its 2021 rally, driven by potential DOGE ETFs and support from Elon Musk. However, market uncertainty is affecting sentiment. Investors are now watching to see if Dogecoin can break past its bearish trend and surge toward $5 in 2025.
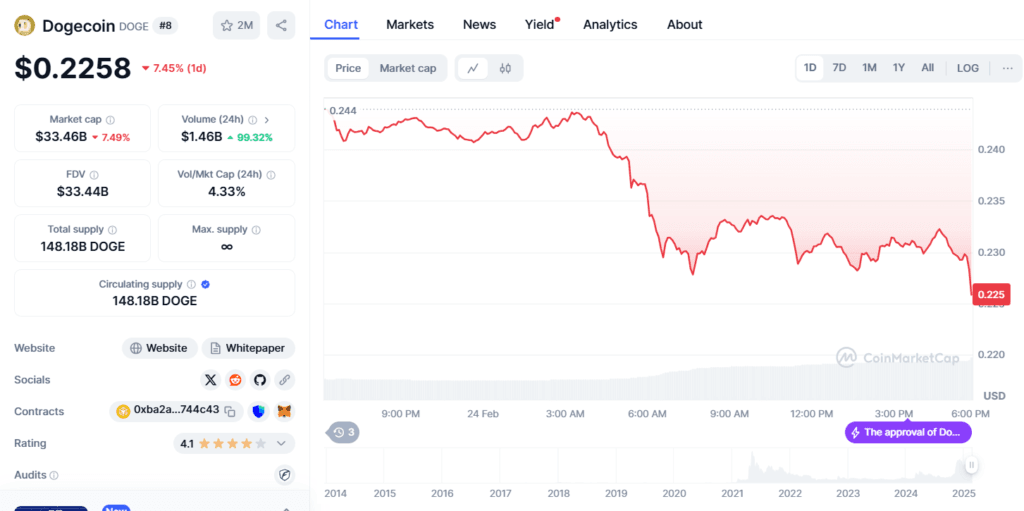
Dogecoin (DOGE) is trading at $0.2258, down 7% in the past 24 hours. The price reached an intraday high of about $0.244 before selling pressure pushed it lower. Despite the decline, trading volume jumped 99.32% to $1.46 billion, indicating intense market activity. Dogecoin’s market cap dropped to $33.46 billion, reflecting bearish sentiment.

Analysts highlight recovery phase with potential $5 target
According to analyst Cas Abbe, Dogecoin is currently in a “recovery phase,” mirroring patterns observed between Q1 and Q2 of 2021. Abbe pointed out that DOGE has experienced three distinct recovery phases since 2016 and is on the cusp of completing the third. If the current trajectory follows the historical pattern, it could pave the way for a significant upward surge.
During the previous recovery in 2021, Dogecoin completed a similar cycle that led to a remarkable 13x price increase within three months. If this pattern repeats, DOGE could potentially climb from its current price to the much-anticipated $5 target in 2025. Adding to the optimism, parallels between the current macroeconomic environment and that of 2021 have further fueled market excitement. Similar to the past, positive sentiment surrounding Dogecoin, driven by strong community support and media attention, may contribute to its upward trajectory.
Technicals show mixed signals hinting at a potential rebound
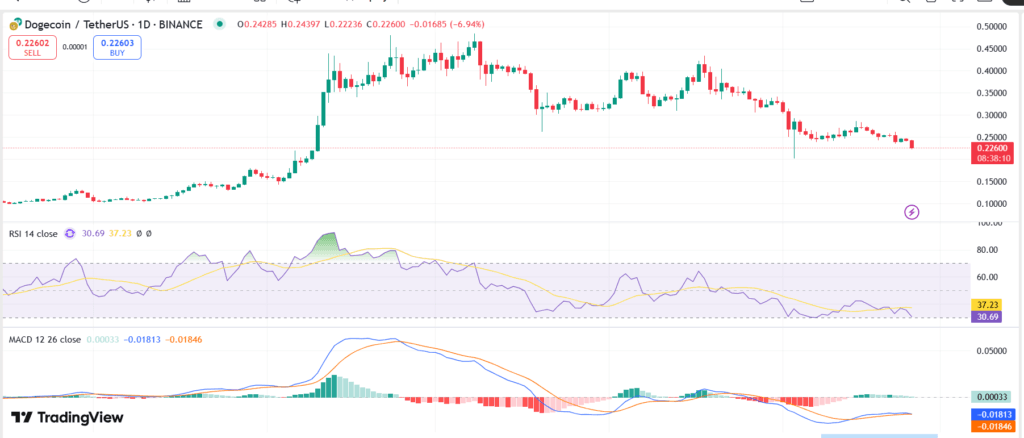
For DOGE, technical analysis shows conflicting indications. The asset is in oversold territory, according to the Relative Strength Index (RSI), which is currently at 30.69. This raises the possibility of a brief recovery in the event that purchasing pressure increases.
The RSI is still below the neutral 50 mark, though, indicating generally lackluster momentum. The MACD line is at 0.00033, just above the signal line at -0.01846, suggesting a potential bullish crossover on the Moving Average Convergence Divergence (MACD) front. In spite of this, the MACD histogram still displays negative values, indicating persistent skepticism.

Price action shows DOGE facing resistance around $0.2439, with immediate support at $0.2223. A sustained move below the $0.2200 level could push the price toward the next support zone near $0.2000. Conversely, a break above the $0.2400 resistance could pave the way for a climb toward the $0.2600 level. In the broader outlook, surpassing these resistance levels and aligning with historical recovery patterns could set the stage for further gains in the long term.


