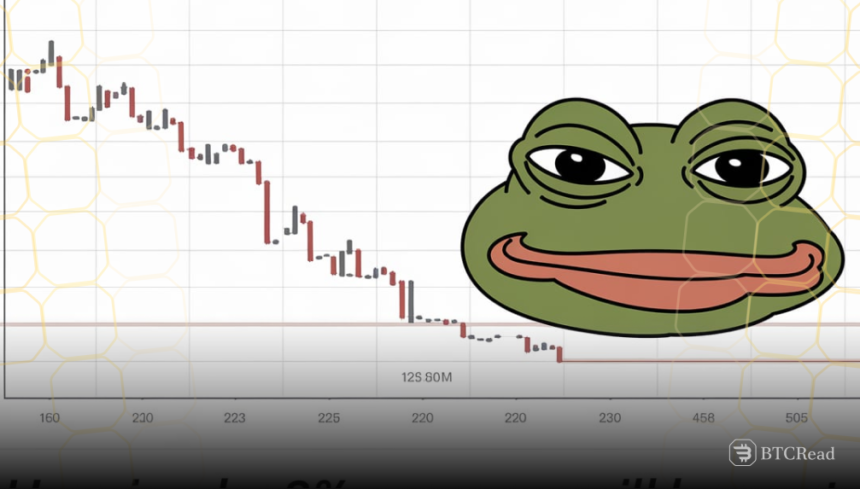
After a dip that stretched the whole crypto market, Pepe is showing renewed action after holding a key support at $0.00000066. The current positioning opens doors for a potential 3% surge, with both MACD and RSI confirming the short term bulls build up.
MACD flattens bearish move as RSI inches bullish zone
The Pepe MACD line sits at -0.00000004, while the signal line trails close at -0.00000017. Histogram bars remain short and slightly red, indicating reduced selling pressure. This tight convergence between the MACD and signal line suggests a possible bullish crossover if upward pressure holds. The MACD has stayed negative since late March, but its direction is now shifting closer to neutral. A crossover in the coming sessions could confirm momentum toward $0.00000070.
The Relative Strength Index (RSI) currently reads 43.37, up from recent lows near 40. The RSI signal line holds at 48.49, staying close to the neutral 50 mark. This tight spread indicates a possible breakout if price action continues pushing higher. If RSI breaks above 50, it would confirm growing strength. This could drive Pepe closer to the $0.00000070 resistance, marking a 3% jump from the current level.
PEPE current market movement revealed
According to CoinMarketCap data, Pepe recorded a notable intraday movement on April 4, reflecting a fluctuating trend with a mild upward bias. The meme coin traded at $0.0006853 by the end of the day, recording a 0.56% daily gain. The price chart shows PEPE opening near $0.0006792 and dropping significantly below $0.000662 before rebounding after 6:00 AM. During the early hours, sellers dominated, pushing the token into a deep red zone.
However, the token reversed direction by mid-morning, moving steadily into the green and reaching an intraday peak slightly above $0.00070. This upward momentum sustained until around noon, when a correction occurred.
The pullback dragged the price closer to its earlier levels, ending near its opening value. Despite the correction, the token remained in green territory at the close of the trading window. Consequently, the price has bounced back to remain above $0.00000066 as shown by the Trading View chart and confirmed by CoinMarketCap data that indicates the levels were tested starting March 30. This zone remains critical.
The April 4 close at $0.000000682 may depict a reversal pattern having been formed after days of pressure in the south. As things stand, it is now clear that Pepe will struggle to regain $0.00000070 without much of an issue. Both the MACD and RSI reflect this short-term target as the sentiment starts to change.


