
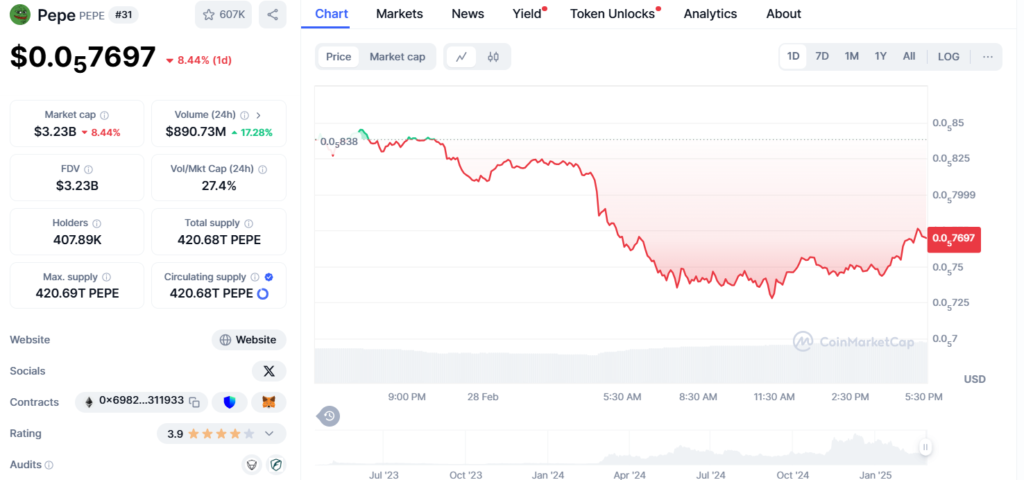
PEPE is still experiencing a decline, trading at $0.0007697, an 8.44% drop in the last 24 hours. Despite this, its 24-hour trading volume has increased by 17%. The market capitalization now stands at $3.23 billion, with selling pressure mounting before signs of a possible rebound. Traders closely watch critical support and resistance levels to gauge potential price direction.
Market sentiment remains highly volatile following recent regulatory discussions. The U.S. Securities and Exchange Commission (SEC) clarified that meme coins, including PEPE, are not securities. This announcement could impact investor confidence and trading behavior, influencing PEPE’s next major move.
Technicals suggest critical levels for PEPE
Technical analysis highlights key levels that could determine PEPE’s next trajectory. Rose Premium Signals have identified a strong support zone, aligning with an ascending trendline and previous breakout levels. This positioning suggests that PEPE could be at a critical turning point, presenting a high-reward entry opportunity for traders expecting a bullish reversal.
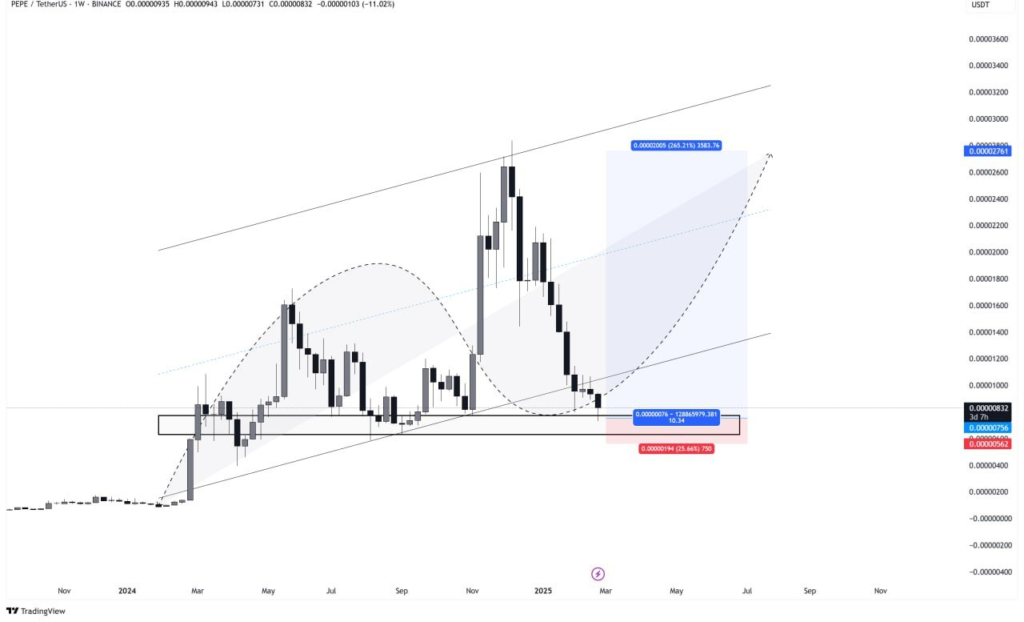
If PEPE maintains its current support, analysts predict a potential 330% rally, targeting $0.00002761. However, failure to sustain this support could lower prices, potentially retesting $0.00000756 before finding stability. While the broader market structure suggests long-term bullish potential, short-term movements remain uncertain and heavily dependent on investor sentiment and market dynamics.
Key resistance at $0.00000926: Can PEPE break above $0.00001076?
The Bollinger Bands (BB) indicate that PEPE is trading near its lower band, signaling possible oversold conditions and a potential price support level. If the price falls below this range, selling pressure may increase, leading to a decline toward $0.00000750.
The Relative Strength Index (RSI) stands at 32.53, nearing the oversold threshold of 30. This suggests that the price rebounds if buying pressure increases. However, sustained weakness in RSI could indicate further downside risk.
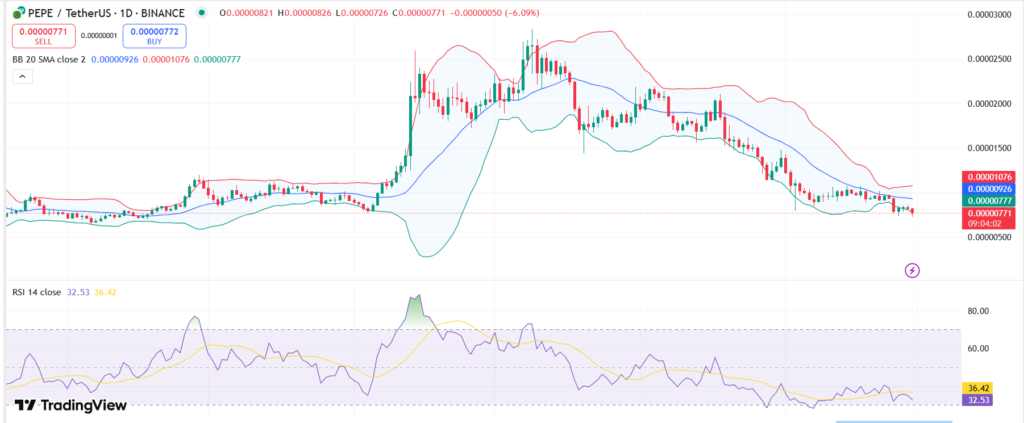
Key levels to monitor include immediate support at $0.00000750. A break below this level could extend losses toward $0.00000560. On the upside, resistance sits around $0.00000926, aligning with the mid-Bollinger Band. If PEPE surpasses this level, it could attempt to break toward $0.00001076. For a bullish reversal, PEPE must reclaim resistance and sustain momentum above it.
Market sentiment and technical indicators suggest that PEPE is at a decisive point, where a strong rebound or further decline is possible. Investors are now watching for confirmation of a breakout or breakdown to determine the next phase of PEPE’s price action.