
Uniswap (UNI) continues to mirror the wider cryptocurrency market downturn. Over the past day, the token has dropped almost 5.22%, extending its weekly losses to 7.78%. At the time of writing, UNI trades at $9.68 with a market cap of $6.08 billion and a 24-hour trading volume of $530.13 million, which has remained relatively stable.
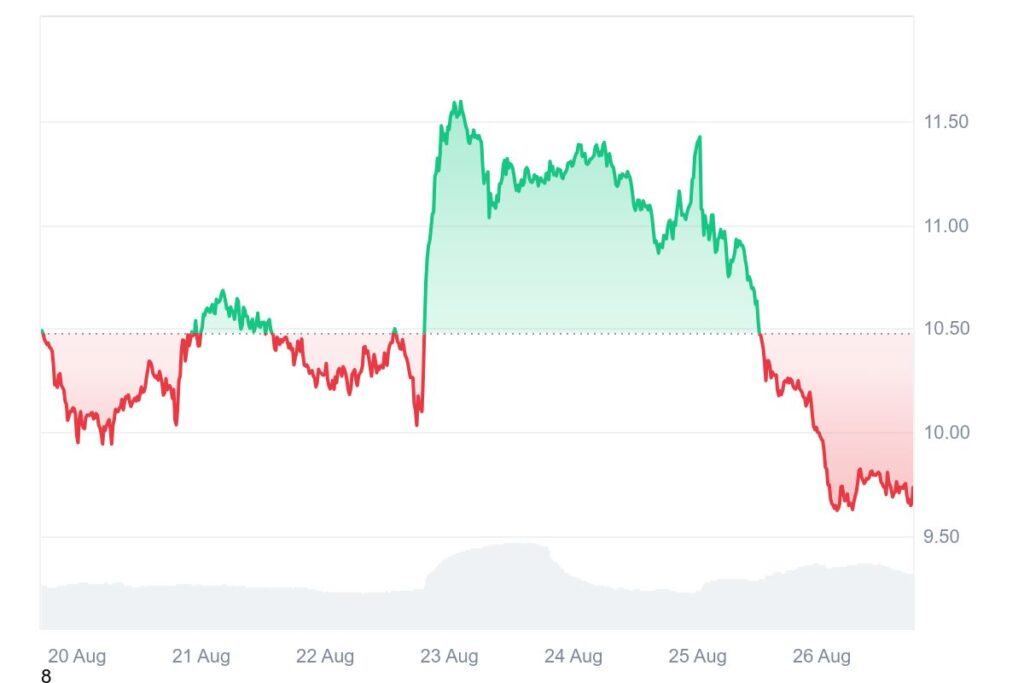
The decisive slip under the $10 psychological mark has intensified bearish sentiment. After being rejected from the $10.50 to $11.00 range, UNI now faces this zone as firm resistance. The four-hour chart highlights a consistent downward pattern with consecutive red candles that underline persistent selling pressure.
Uniswap technical indicators show weakness
Bollinger Bands confirm growing volatility, with UNI moving closer to the lower band at $9.39. This positioning signals oversold conditions, yet the strong downside drive suggests bears maintain control. The support zone between $9.39 and $9.00 is now crucial. A breakdown below this level could drag UNI further toward $8.50, a historical support area that may attract new buyers.
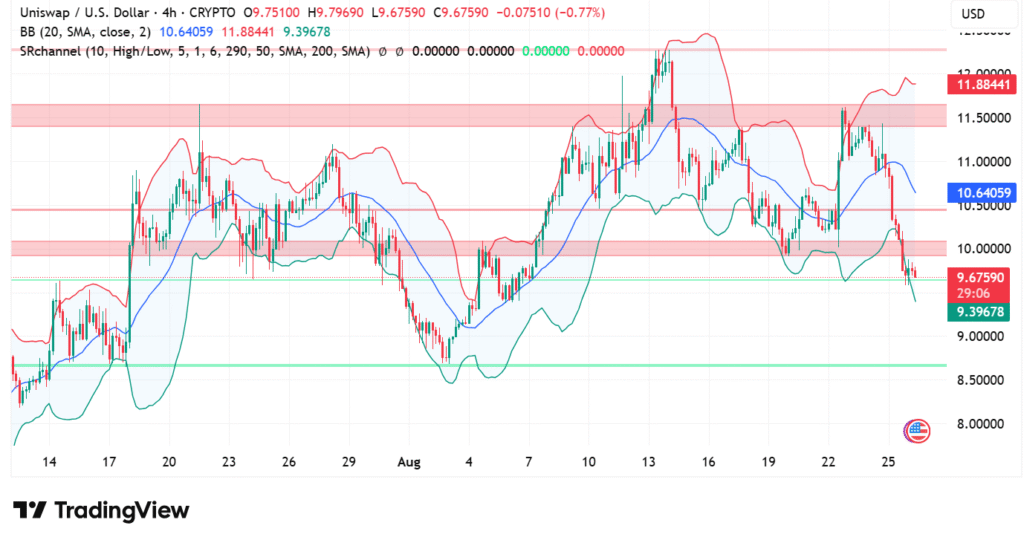
For any meaningful recovery, UNI must reclaim the $10.40 to $10.60 zone. Only then could the token attempt a push toward the $11.50 to $12.00 resistance region. Without such a move, the market remains tilted toward further declines.
RSI and MACD confirm bearish momentum
The current value of Uniswap is $9.67 and has gone down 0.80% in the day’s trading so far. Relative Strength Index (RSI) has decreased to 29.67 to justify the oversold status. Although that could imply a short correction, the 40.74 value of the RSI moving average indicates a definite bearish divergence.
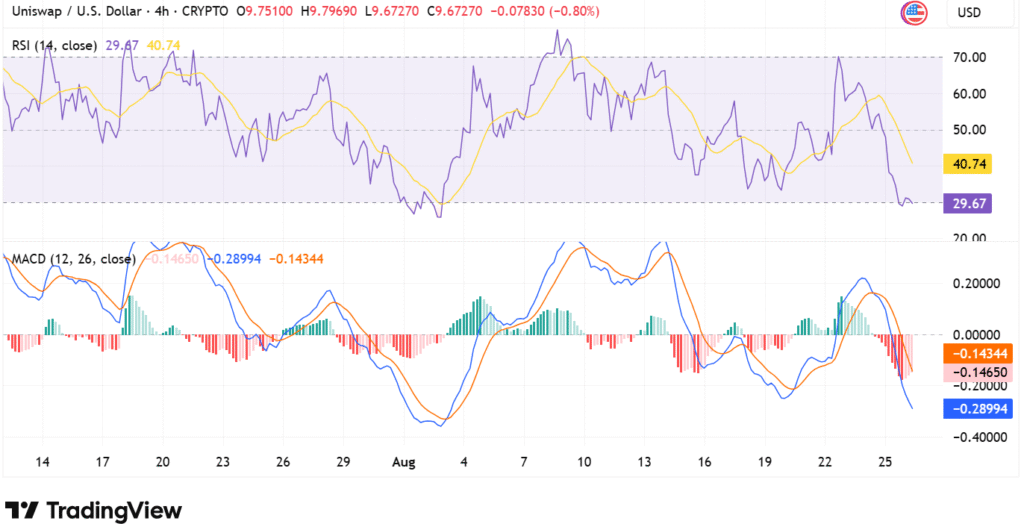
The MACD also shows continuing negative momentum. The MACD line of -0.28994 keeps dropping below the signal line of -0.14344, and histogram bars reach deeper into negative territory. This is a signal of weakening momentum and shows continued pressure unless support levels stabilize.