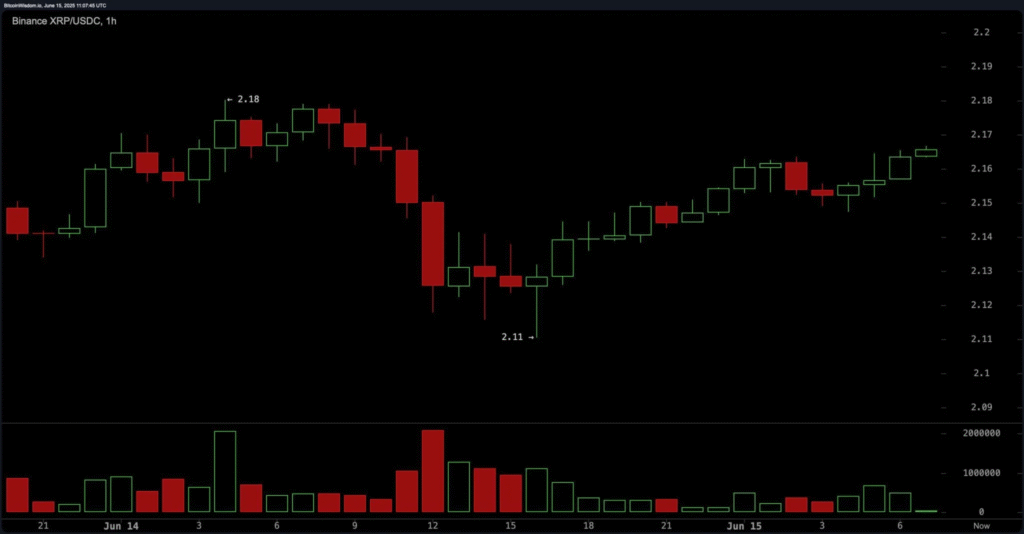
XRP trades at $2.16 as of June 15, 2025. Its market cap stands at $127 billion. The 24-hour trading volume hit $1.438 billion. Price action stayed between $2.11 and $2.18, showing little movement but rising tension. This narrow range hints at a possible breakout or breakdown soon.
On the one-hour chart, XRP bounced from $2.11 to $2.17. Buyers stepped in during dips, creating higher lows. Volume remained steady, but not strong. Traders acted cautiously. A few long positions appeared near $2.13.
Resistance sat between $2.18 and $2.20. Unless buyers push beyond it, the upside remains capped. The four-hour view gives a wider look. XRP dropped sharply from $2.33 to $2.08 earlier this week. That fall came with high volume and strong selling. Since then, XRP has moved sideways.
XRP struggles below key resistance levels
It stayed within a narrow band from $2.10 to $2.17. This might be a bear flag. If the price breaks below $2.10, the downtrend may resume. If it climbs past $2.18 with force, momentum may flip in the bulls’ favor. Some short-term traders set targets near $2.25. Zooming out, the daily chart paints a darker picture.
XRP peaked at $2.656 recently, then sank fast. It now struggles to hold above the $2.05–$2.10 area. Weak buying has emerged but not enough to reverse the fall. Red candles still dominate, showing steady selling. Buyers need a close above $2.22 to shift the tide. Until then, bears hold control.
Momentum signals offer mixed signs. RSI sits at 44.17, showing no clear trend. The Stochastic oscillator and CCI point to weakness. The ADX at 17.73 confirms the trend lacks strength. Only the momentum reading stays slightly positive. The MACD shows a bearish lean.
XRP clings to 200 EMA as bears dominate
The moving averages balance the sentiments in favor of bears. Short-term and middle-term EMAS and SMAs all support the price from above. These are 10, 20, 30, 50, and 100-period lines; they all point down. Only the EMA at $2.09 per share offers hope, but every other line is in a downtrend.
It also indicates long-term support; the SMAS 200 still lags far up above at nearly $2.38. XRP still follows the trend downward. The bulls need to see the price above $2.20 strongly; then only we can speak of an uptrend. Until that takes place, traders may look for more weakness to come.
A fall below $2.05 could lead to more downside pressure in your minimum targets at this point; there is currently zero justification in trying to jump on the back of a single order flow level or news announcement. follows caution and lets all contradicting variable unfold their logic and proper course