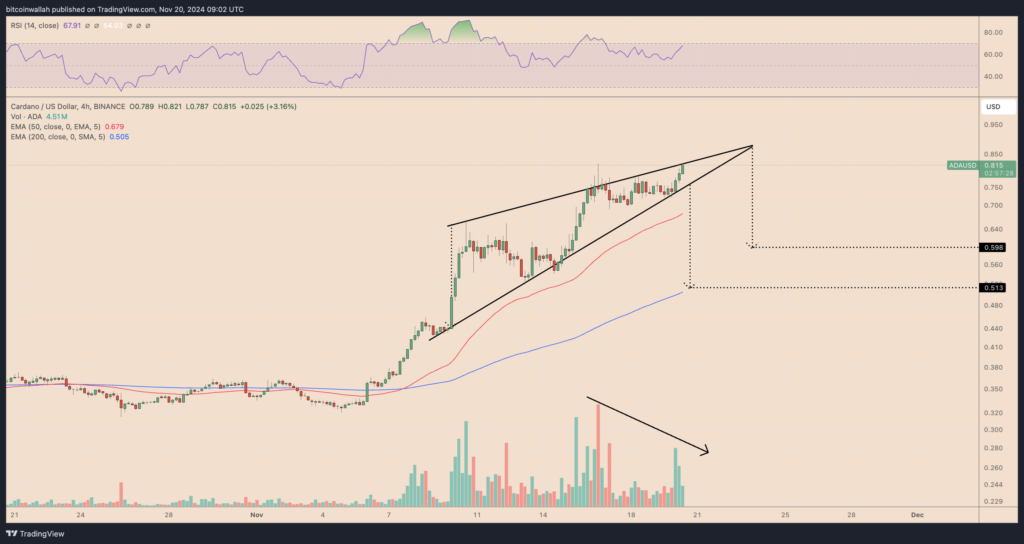
Cardano price has surged by 140% this November, largely driven by Donald Trump’s reelection as U.S. president. However, recent indicators hint that these Trump-fueled gains might not last long. ADA’s 4-hour chart reveals a bearish “rising wedge” pattern, signaling a possible price dip soon. The upward-sloping trendlines forming this pattern often hint at a possible downward trend reversal.
If ADA falls below the wedge’s lower trendline, the price could drop by an amount roughly equal to the wedge’s widest section. In the short term, the price could potentially target around $0.598, but in a more bearish scenario for November-December, it might drop to $0.513.

Interestingly, the $0.513 mark, about 35% lower than the current price, coincides with the 200-period exponential moving average (200-4H EMA) on the 4-hour chart, represented by the blue wave.
Is Cardano’s price surge headed for a correction?
Cardano’s recent price climb was led by declining trading volume, raising concerns about the rally’s strength. Bearish patterns like the rising wedge typically attract more credibility when trading activity slows down. Additionally, the chart reveals a mismatch between rising prices and a falling Relative Strength Index (RSI), signaling a bearish divergence. This further points to weakening upward momentum.
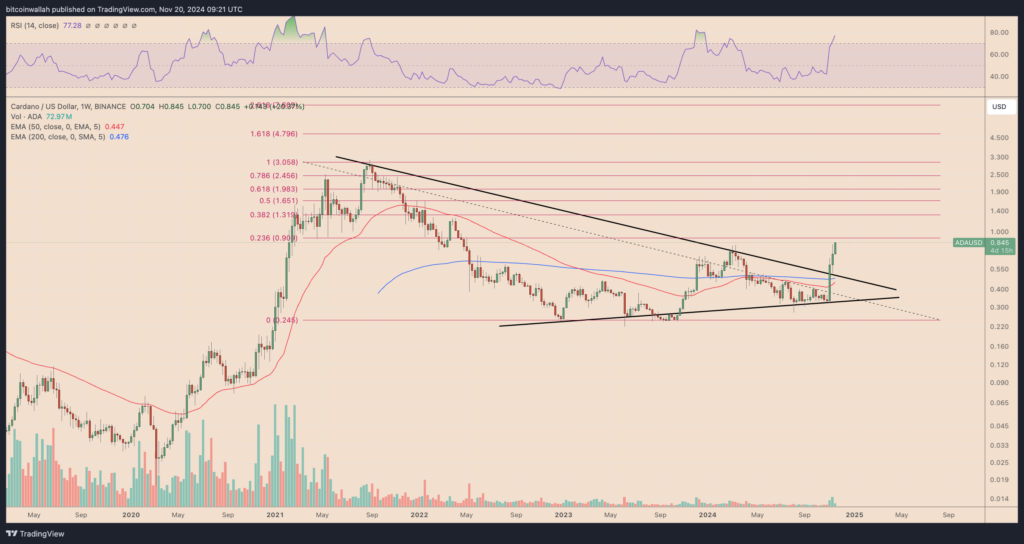
The RSI is currently at 68, close to the overbought level of 70, indicating that Cardano might be entering an overextended phase and could face a price correction. However, if ADA breaks decisively above the wedge’s upper trendline with strong trading volume, it could overturn this bearish prediction. This move could open the door for testing the $0.90 resistance level, which aligns with the 0.236 Fibonacci retracement on ADA’s weekly chart.

According to fractal analysis, $0.90 has been a significant distribution point since Apr. 2022. For example, ADA experienced a 65-75% drop after testing resistance in Mar. 2024 and Apr. 2022. This pattern suggests a similar correction could occur during the November-December period.


