The value of Ethereum currently stands at $2,429.43 on June 24, 2025, with a daily increase of 7.56% despite past weekly declines. The trade value reaches $27.85 billion, and the combined market capitalization on all the observed exchanges totals $292.46 billion.
Even though Ethereum fell by 5.62% within the past seven days, consistent market trends indicate another rise to follow. Ethereum’s chart structure continues forming a symmetrical triangle, widely known as a signal of consolidation before a price breakout.

The chart given by analyst VipRoseTr positions ETH amidst two oncoming trendlines, creating a triangle from January to June 2025.
Positioning now puts ETH in the mid-zone, a region around $2,246, which experienced traders are looking at as an accumulation level. With trendlines sloping from lower highs and higher lows, this pattern visually narrows toward an apex in upcoming weeks.
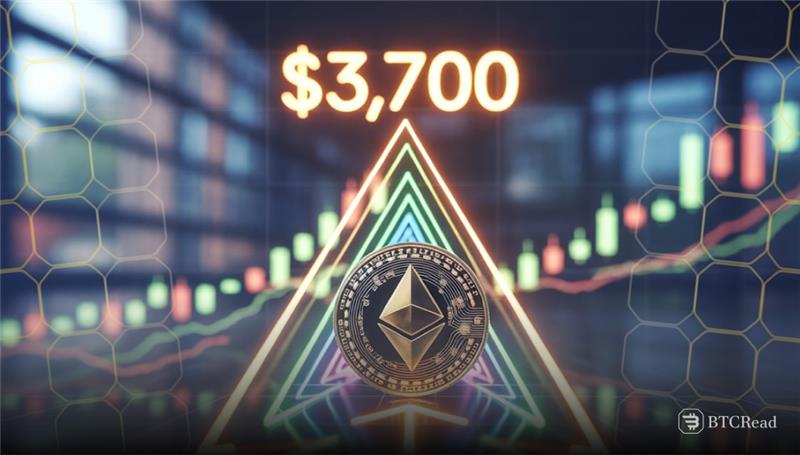
These chart patterns will often signal periods of indecision, with final breakouts extending to the top of the triangle. The Ethereum triangle spans a rough $1,000 range between $1,800 and $2,800, and breakout levels near $3,700.
Long-Term ethereum projection reaches $7,000
Mid-term technical targets show values at $3,700 and $4,450, while long-term ambitions point to the $7,000 level. These forecasts align with broader forecasts, such as Changelly’s Ethereum 2025–2030 outlook, which predicts a price above $6,500 per coin.
Institutional wallet information indicates a 2.3% increase in large positions since February, indicating growing interest among larger investors. Despite the pattern’s bullish nature, external factors still weigh on short-term confidence among traditional finance participants.
Ongoing geopolitical risks, such as Middle East tensions, may trigger risk-off sentiment within high-cap crypto circles. Traders who wish to get exposed can consider entering near $2,200–$2,300 with very tight stop-losses below the $2,000 level
Confirmation of trend strength requires a clear breakout above $2,500–$2,600 with volume rising on higher timeframes. For accuracy, users must pair this pattern analysis with live indicators such as RSI, MACD, or moving averages.
Reviewing Ethereum charts on Binance or TradingView will improve decision-making before entering significant positions.