Hedera (HBAR) has emerged as a hot topic among technical analysts due to a bullish harmonic pattern on its daily chart. The coin registered a one-day rise of 9% to take its monthly return to over 103% as it garnered much attention within the broader cryptocurrency community.
The recent breakout is within the CD phase of the Bearish Crab pattern—commonly linked with strong final-phase breakouts. The pattern established at $0.1275, to $0.2922, and is poised to tag a possible $0.4262, a 45% rise above the current level upon completion of the pattern.
HBAR’s price breakout came after months of consolidation. Momentum shifted after bulls cleared major resistance levels. Trading volume has surged alongside price action, indicating strong demand. Analysts are now closely tracking the token’s advance toward the longer-term $2.00 price objective.
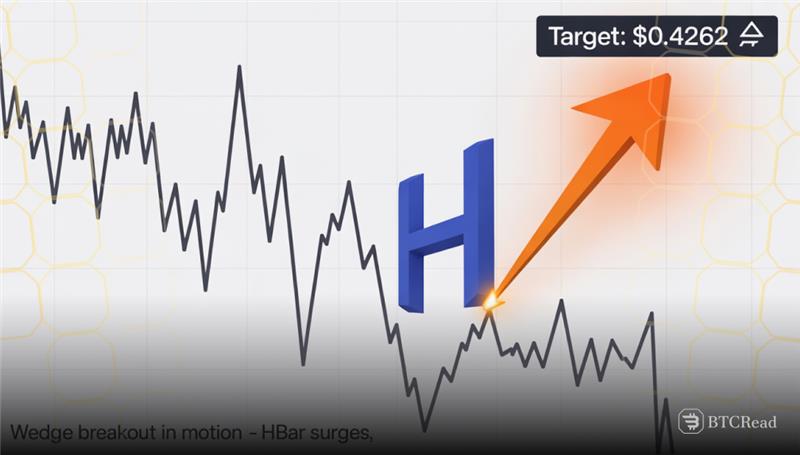
Falling wedge breakout sparks uptrend shift
The short-term HBAR/USDT chart is registering a breakout of the active February-established descending wedge pattern. The breakout, confirmed by the bullish green candlestick, propelled the price through $0.25 to bring the prolonged consolidation capping past gains to a close.

The weekly charts depict large green candles with small upper wicks, as there is very little selling pressure since the breakout. Prices have broken through resistance zones at $0.35 and $0.50 and are close to the psychological $2.00 level as bullish momentum remains intact.
The $0.24 resistance is turned into solid support, and it is the investor sentiment’s pivotal level. Remaining above $0.26 with the volume strength can take the HBAR to test $0.27. A breakdown below $0.24 can halt the gains to begin the short-term consolidation.
Hedera gains 3.27% amid strong momentum
The current market cap for Hedera lies at $11.33 billion following the intraday gain of 3.27%. It recently touched $12.68 billion before the appearance of some profit-taking. But the long-term bullish setup remains intact as the investor interest remains steady.

MACD readings show the MACD and signal lines converging with a histogram at -13.32M. That implies cooling momentum but does not portend a full reversal. Earlier MACD crossovers, way back last July, powered strong upward surges that are continuing to form current trends.