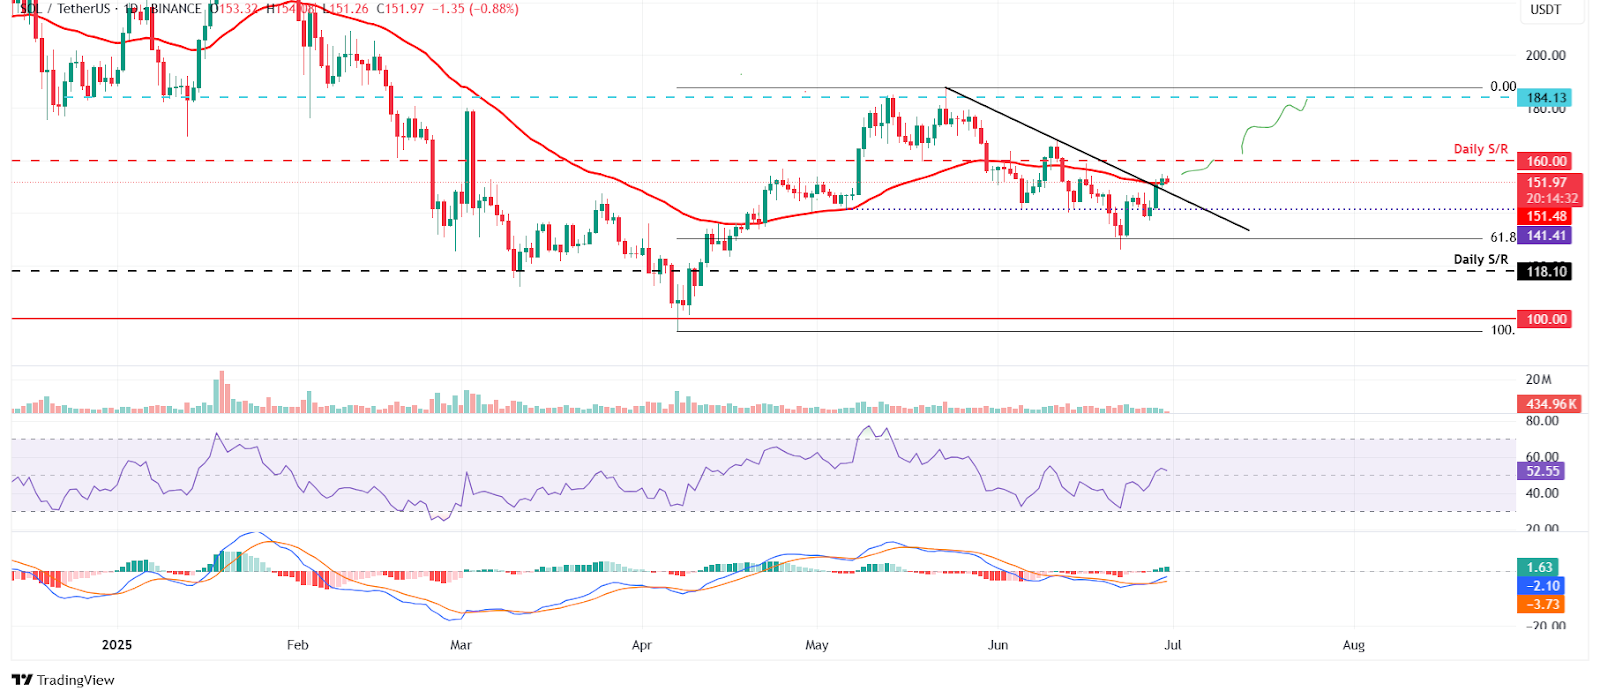
Solana (SOL) is currently trading at approximately $151 after breaking above a descending trendline, sparking hopes of a sustained rally. The breakout had established the cryptocurrency above the 50-day Exponential Moving Average (EMA) as a bullish reversal signal.
Analysts are eyeing Solana’s next significant resistance at $160, with the possibility of subsequent increases to $184.13. If sentiment improves and current trends persist, the level of $192 could be reached by SOL, which matches analysts’ expectations. That bullish narrative gets another boost from speculation about the upcoming launch of a Solana ETF in the U.S.
Solana ETF Filing Stirs Speculation and Hype Within Markets
REXT Shares recently filed a Solana staking ETF with the U.S. Securities and Exchange Commission (SEC). That has awakened optimism among investors, who believe approval will act as a catalyst for a major break higher. An approval would mark a milestone in the mainstream financial adoption of SOL.
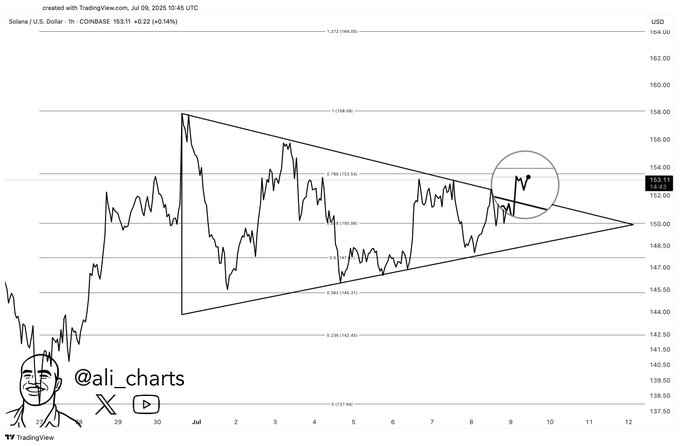
Ali Martinez highlighted Solana’s breakout through a symmetrical triangle pattern, a trend continuation signal. Such a pattern is defined by crossing trendlines, a breakout through resistance typically indicating a good setup for a bullish surge. Solana’s higher break in such a structure supports the storyline of a move up to increasing prices.
Symmetrical Triangle Breakout Confirms Bullish Bias
The symmetrical triangle signals a consolidation phase with narrowing price action. Solana’s breakout to the upside cements a bullish bias. Compared to falling or rising triangles, symmetrical triangles have no direction bias inherent to them, which makes breakouts stronger when bolstered by volume and fundamentals, such as an ETF catalyst.
It’s a symmetrical triangle with lines of resistance and support converging towards each other. While descending triangles are generally bearish, indicating a trend reversal, symmetrical triangles are neutral signal charts of consolidation.
Breakouts, particularly higher ones as witnessed with SOL, tend to spark a significant price action following the direction of the breakout. Analysts identified $164 as their next target, which aligns with the 1.272 Fibonacci Extension level.