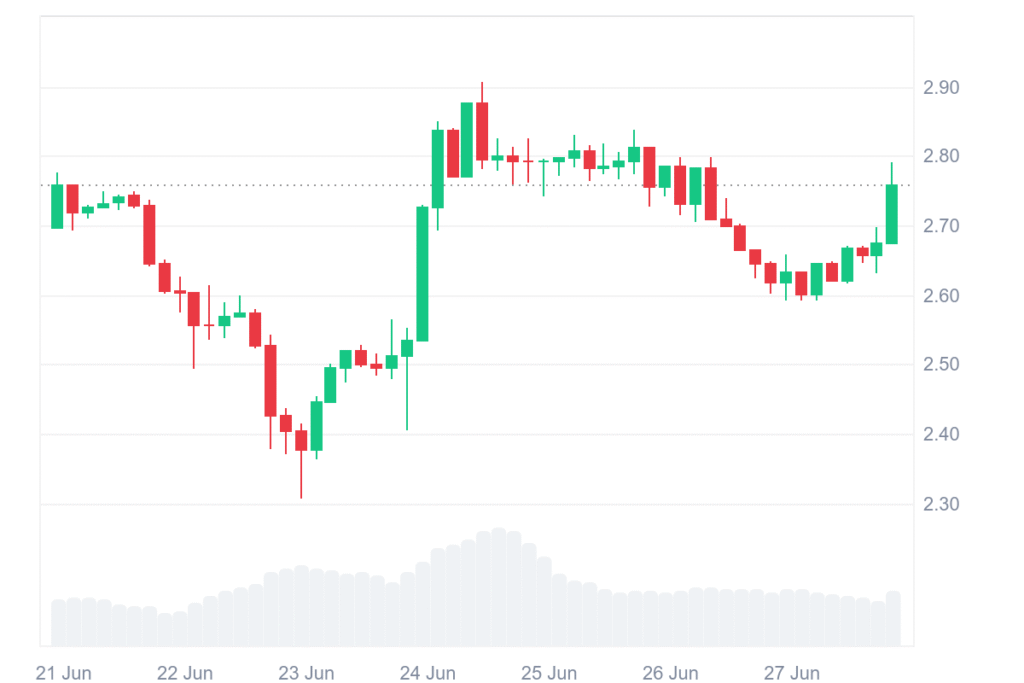
Sui currently trades at $2.78, with 24-hour trading volume reaching $992.27 million and market capitalization touching $9.47 billion. The token shows a 6.92% rise over the last day and a 2.00% gain over the week.
This performance highlights a strengthening trend, showing investors are preparing for higher price movements in the near term.
Analysts tracing the one-day Binance chart employ Elliott Wave Theory to outline SUI’s journey from early 2024 through mid-2025. The price began from the level of $0.50 in April 2024 and has progressed through $1.40–$1.80, finishing Wave (1).
This five-step impulse wave had three upward thrusts and two corrections, and Wave 3 showed the strongest movement and final resistance around $1.80.
After reaching this peak, SUI entered Wave (2), falling to around $0.90–$1.00 before stabilizing. This decline reflected not only technical behavior but also global instability, particularly conflict in the Middle East and the $223 million Cetus Protocol hack. Both events increased selling pressure, pushing the correction deeper than expected for Wave (2).
SUI Eyes $10 target as wave three advances
However, having the corrective phase completed, the setup is in place for Wave (3) with the potential from $1.80 towards double digits. With the Elliott Wave forecasts and the prior impulse patterns, the year-end 2025 target for SUI is an all-time high of $10.00. Analysts expect Wave (3) usually has the most powerful action, often well-surpassing Wave (1) by a considerable distance.
The chart makes use of geometrical symbols like a green filled area to outline likely targets and red circles to indicate vital wave zones. Key support and resistance levels rest at $1.00 and $1.80, respectively, which serve as confirmation zones for future upward moves.
Nonetheless, while technical models such as the Elliott Wave can predict structure, elements outside the market like sentiment and world events also must be correct.