
BNB currently sells at $631.97, with the trading volume for the last 24 hours at the level of $1.61 billion across exchanges. Its market capitalization currently stands at close to $89.03 billion, putting the cryptocurrency under close observation by traders.
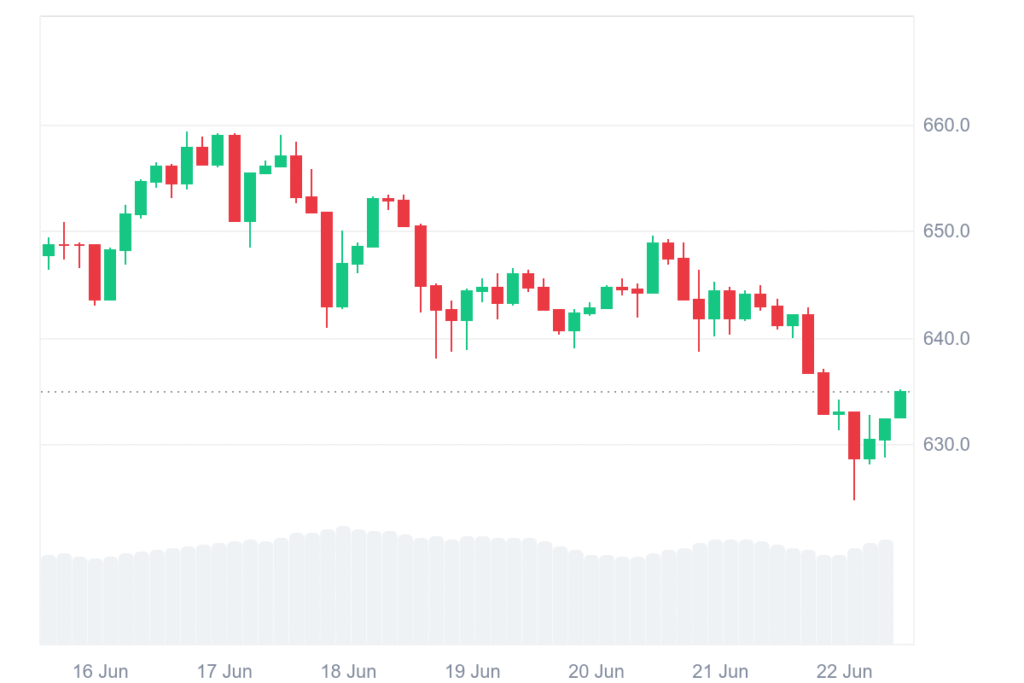
Despite attempts at stabilizing within an upper price range, trading sessions recently have signified an enduring downtrend across the chart. The price has gradually gone down, forming a pattern of red candlesticks that signify rising sell-side strength within the current market setup.
The selling trend pushed BNB beneath several minor support levels, eventually driving it close to the $630 region. A few green candles emerged to hold the price, but overall recovery momentum appeared faint.
Volume has increased, particularly during periods of decline, suggesting firm control by bears over trading direction. Resistance is now seated around $645, while current support rests near the $629 mark, just above a psychological zone of concern for investors.
Technical Indicators Reinforce weak outlook for BNB
Bollinger Bands reveal widening space, with the present price clinging to the lower band around $631, revealing a fluctuating pattern. Midline, the 20-period simple moving average, is at $640, which BNB has not managed to cross. This betrays lack of strength on the upside.
RSI at present rests at 35.40, which is still below the neutral 50 line, suggesting sustained weakness and languid momentum. While there is an attempt to move up marginally, the index is not yet robust enough to turn sentiment.
MACD indicators validate a bearish crossover since the MACD line lags behind the signal line and the histogram displays increasing red bars. This indicates decreasing momentum keeps accumulating without yet showing signs of decay.
Without a stronger recovery attempt showing up soon, BNB could slide down toward the next support level near $620. Price action, however, could test the $645 resistance level in the near term should market sentiment pick up.