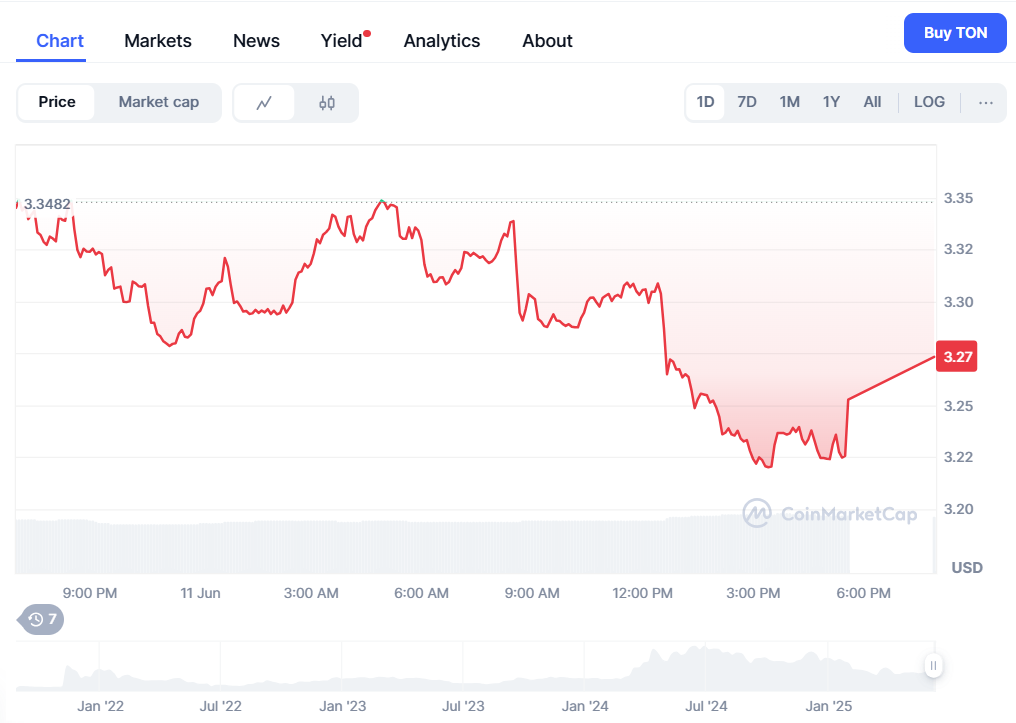
Toncoin (TON) now trades at $3.28, slipping 1.79% on the day. Despite the dip, daily trading volume climbed to $309.53 million, up 5.75%, hinting at growing trader interest. Over the past week, TON saw a 4.16% gain, holding steady amid broader market turbulence.
Analyst VipRoseTr points out the compression phase of TON. According to his chart, there is a breakout setup with targets at $4.21, $4.77, $5.35, and $6.16. Each level corresponds to the classic logic of triangle breakout principles. The analyst labels the current zone as a launchpad and not a pit stop.
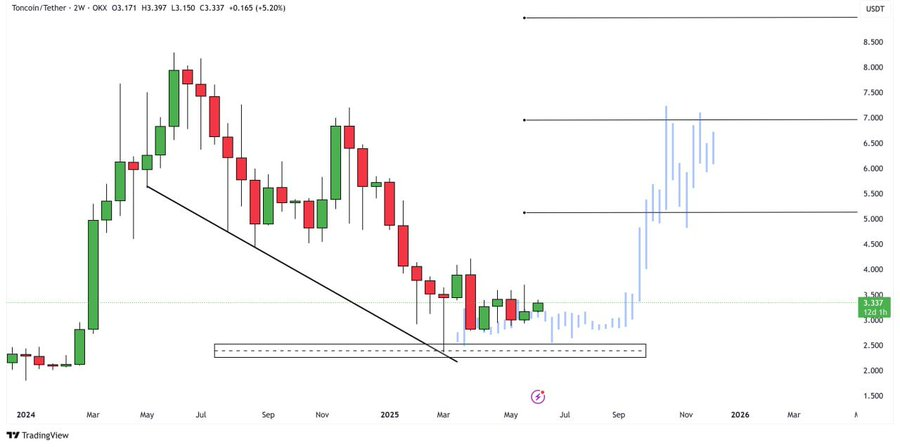
Toncoin price shows long downward trendline
From May 2023 to March 2025, TON’s candlestick chart shows a black trendline descending into a tight squeeze. That trendline marks a slow bleed in price, lower highs and flat lows. But now, a bullish green wave has emerged past that purple circle of compression.
Volume speaks for itself. There was a 394.50% increase in volume on June 11, 2025. That corresponds to the rebound from the $3.00-$3.50 support zone. Price action goes far beyond noise; it indicates true intent. With every green
TON May Rise If Bitcoin Rally Continues
Changelly predicts a wide range for TON by June 2025, between $3.61 and $8.09. The volatility shows both the risk involved and the potential return. DigitalCoinPrice provides a more precise prediction, TON might hit $5.81 again and could even exceed $7.16 and $8.24 later this year.
If the momentum holds and Bitcoin leads the rally, then TON could also be traded similarly. Analysts think that if it crosses the resistance level, then $6.37 to $7.16 could be the new normal. However, inflation data and macro pressure can shake this fragile setup later on.