
TRON (TRX) recorded a volatile trend for the last week as prices recorded both increases and decreases. The coin first dropped early in the week but was able to mount a strong rally towards the $0.250 price.
In the aftermath of the comeback, TRX suffered another steep fall that nullified almost all the previous gains in the rally. There was a move up in the market shortly after that, yet the second rally never hit the earlier high, representing diminished buying.
This failure to break through the former peak indicated that the trader was becoming increasingly cautious and that there would follow more subdued price movements in the following sessions.
Sideways trading was characteristic of the middle part of the week as the prices remained in a narrow trading range without definite direction.
TRX experienced a steep decline later in the week as sellers forced the price beneath the $0.245 level to add to the bearish momentum.
TRON (TRX), as of the last update, traded at $0.2450 on a market capitalization of $23.25 billion and a daily trading volume of $427.25 million. The crypto posted a 1.5% fall in the last 24 hours and a 0.90% fall in the whole week.
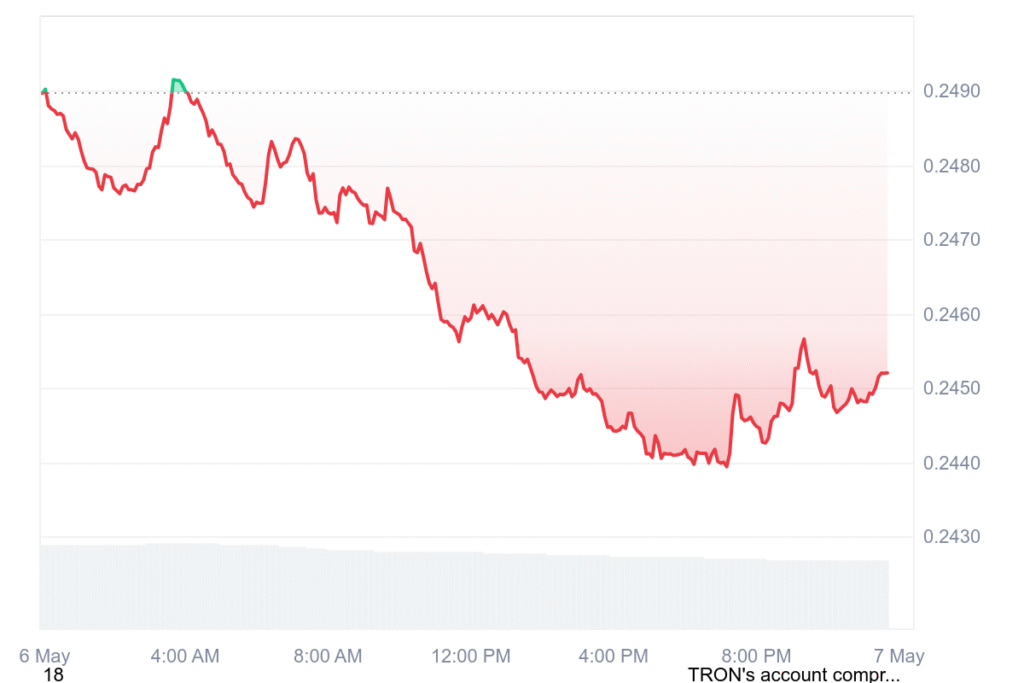
TRX closed lower despite bullish attempts
The coin closed lower in the trading week despite previous efforts to rise, capturing the overall selling strength. TRX was trading below the 20-period volume-weighted moving average, which indicates market weakness continues.
The price is approaching the lower Bollinger Band, showing selling pressure persists and price volatility has remained relatively stable.
The technical indicators indicate the relative strength index has dropped to 39.76, close to the region of oversold levels and diminishing momentum.
Nonetheless, the moving average convergence divergence chart also signals a bearish crossover as the MACD line crosses below the signal line. The market continues to sustain the bearish outlook unless buying support appears at important price levels in the next trading sessions.