
Bitcoin continues its powerful climb, reaching record-breaking highs as it begins a crucial new stage of growth. From late 2024 until May 2025, Bitcoin has seen steady movement, marked by sharp corrections and strong recoveries.
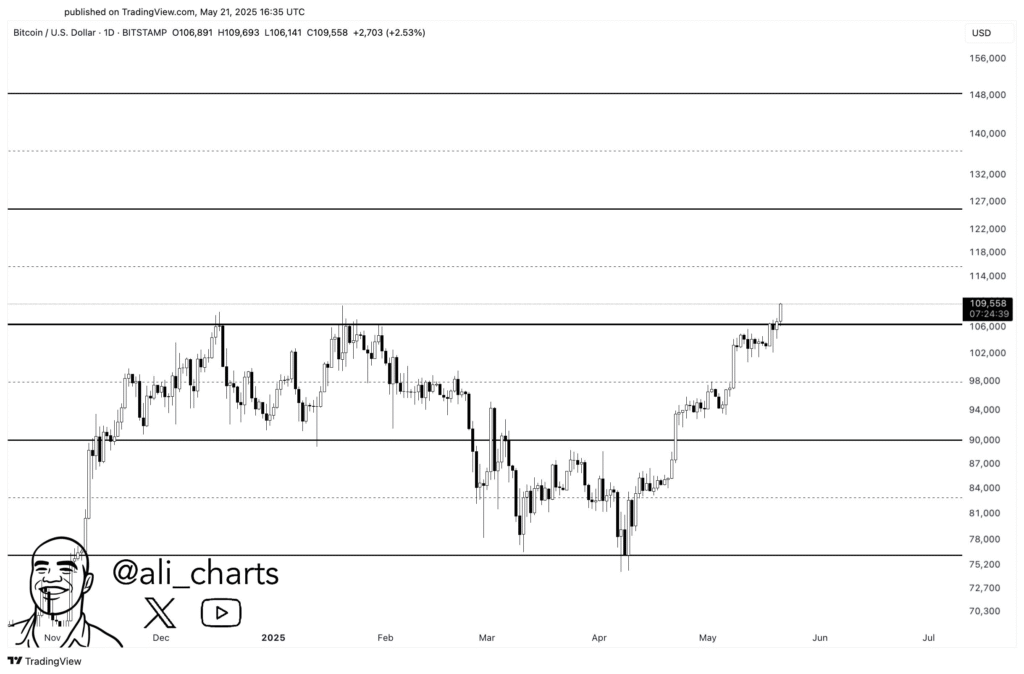
The price began near $70,000 late last year, dropped slightly to $65,000, and later surged past major resistance lines. Ali, a popular chart analyst, posted a close-up candlestick chart on May 21, 2025, capturing the recent advancements of Bitcoin.
The chart captured the break above the old ceiling as well as entry into a novel price discovery level. At the time, Bitcoin rested at almost $108,000, very close to CoinDesk’s reported figure of $107,745.95 on the same day.
Ali’s chart outlines four important price points that traders should watch in the coming weeks. These figures include $116,000, $126,000, $136,000, and $148,000, each representing possible resistance levels. Though the method for selecting them isn’t detailed, they reflect previous price behavior and important technical zones.
New resistance levels shape Bitcoin’s ongoing momentum
The chart also points out meaningful areas of consolidation, particularly in the $95,000-$100,000 zone, where Bitcoin stalled before continuing upward.
The action mirrors previous patterns observed in previous bull cycles, resonating with recent talk in cryptocurrency analysis communities. These patterns demonstrate the firm market interest supporting Bitcoin’s speedy advance.
Fidelity Digital Assets has recently referred to this present phase as an “Acceleration Phase,” in which investor demand increases steeply. They have seen large-scale purchasing by institutions and ETFs and seem to be fueling rising prices.
The chart includes a cartoon figure and a signature style courtesy of Ali Charts as part of the post. As Bitcoin pushes even deeper into new territory, the next significant challenges will be at the noted resistance levels. Strong demand could carry prices toward those upcoming milestones in the next few months.