
Bitcoin soared to an all-time high of $109,000 after months of consolidation. This explosive move followed a prolonged rangebound market, with signals hinting at impending volatility. Key metrics reveal the factors leading to this remarkable surge.
Glassnode reported that net capital inflows have been high following Bitcoin’s touchdown at $100,000, generating profit-making. Nonetheless, this phenomenon has subsided, leading to the reduction of sell-side pressures. As realized profits fall, the market will stabilize, and thus, there will be a balance between supply and demand.
Currently, Realized Cap stands at $832 billion, and monthly, it increases by $38.6 billion, which shows that overall on-chain activity is better now due to the movement of the capital between the ledgers. Types of profit-taking had an all-time high of $4.5 billion by the end of 2024 and then shrunk by 93% to $316.7 million.
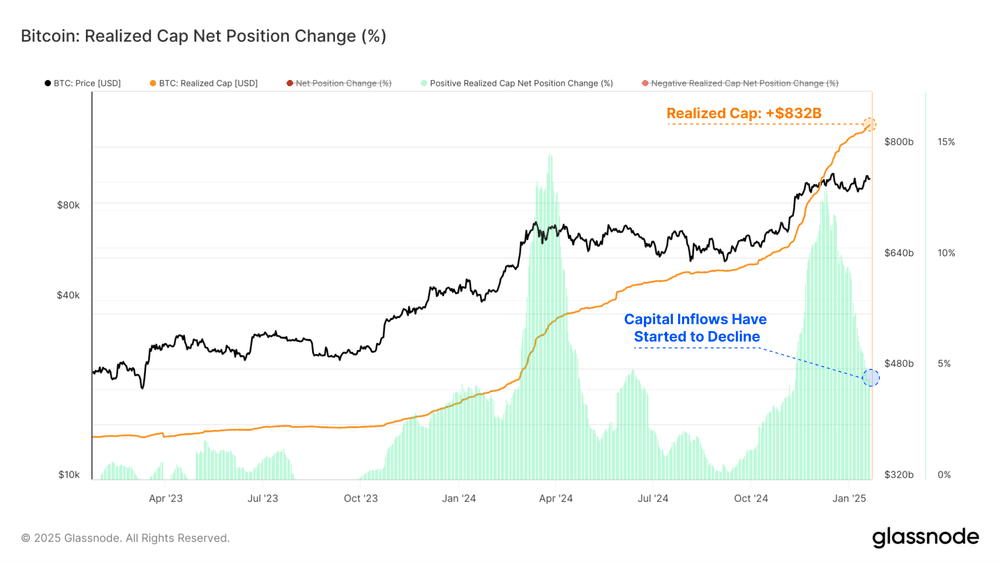
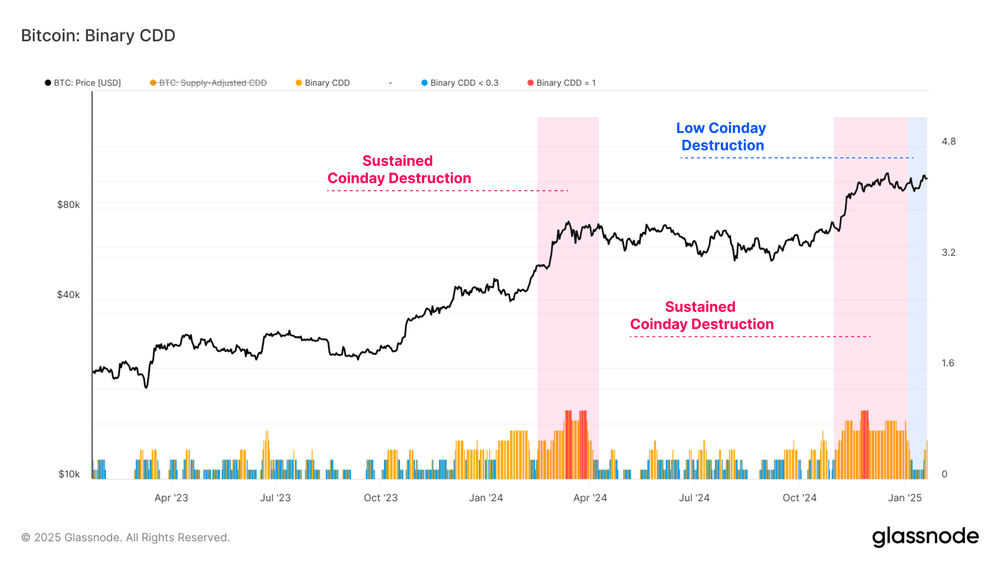
This drop in realized profits corresponds to a slighter expected sell-side while there becomes less need for new capital to preserve the same price levels. A number of indicators, such as Coinday Destruction and Binary CDD, confirm that considerable distribution pressure has waned. It hints that long-term investors are taking profit time.
Bitcoin long-term holders show renewed accumulation
Long-term holders (LTHs) show signs of accumulation as their spending volumes decline. The LTH supply, which dropped during December’s rally, is now recovering, suggesting renewed confidence in holding.
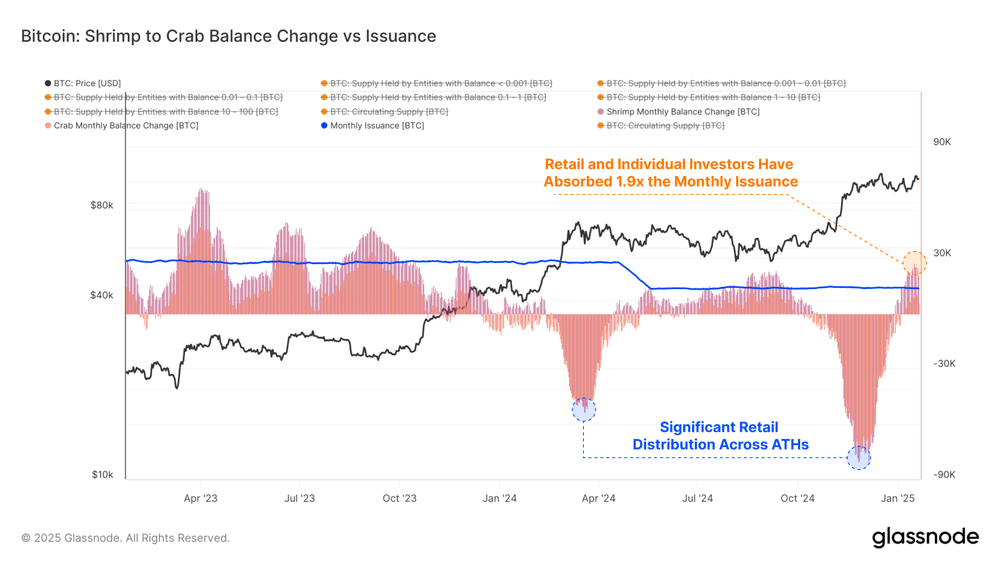
Moreover, the number of inflows to the exchange has also seen a steep reduction. This appears to be pointing to the decline in speculative activity. The 1.9x Bitcoin monthly issue was absorbed by retail investors, who are also the Shrimp-Crab cohort and the drivers of demand in the market.
Volatility indicators point to the possibility of a swift change in the price. The prices are getting narrower, and the supply at the current spot price is being heavily concentrated. It could likely enhance market reactions to a price fluctuation.
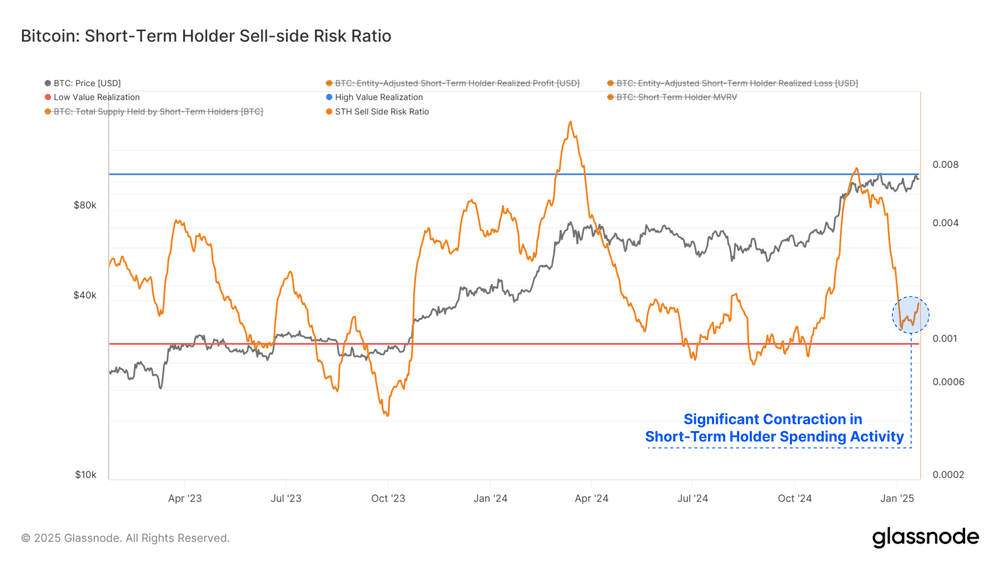
The indicators of the Realized Supply Density and Sell-Side Risk Ratio reflect that the market is heading toward a low volatility phase. It tends to be a harbinger of at least one significant movement.
The consolidation that Bitcoin has entered now has released supply, where the participants have high positioning costs while the next volatility wave is looming. Reduced sell-side risk and thriving on-chain activity are pointing to stable ground for more bullish moves. Specifically, in these market circumstances, Bitcoin was making the market adapt to the new price range, and hence, it is likely that another breakout is the next coming.