
Bitcoin recently hit a fresh all-time high of $122,380, triggering a wave of enthusiasm. However, price have started consolidate as the crypto asset back to the explosive rally. The short correction is considered healthy as an indication of future potential for the continuation of the larger uptrend.
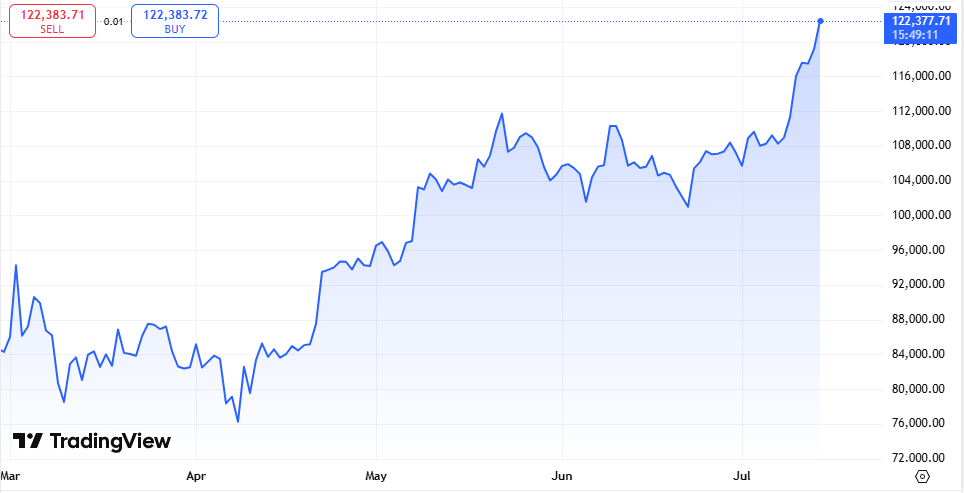
Despite holding above the $117,000 support line, market analysts suggest a deeper correction could unfold. Cryptocurrency analyst TehThomas is calling a short-term correction, possibly down to the $109,000 or even the $110,000 area. Such areas might act as important support regions, providing potential rebounds in the event market forces test them.
Possible correction toward $111K-$113K zone
The most recent rally brought Bitcoin to record price heights, prompting investors to sell and take profits. This could lead to additional selling pressure in the near term. TehThomas highlights an ascending trendline intersecting $111,000–$113,000, indicating a possible correction zone where liquidity might be targeted.
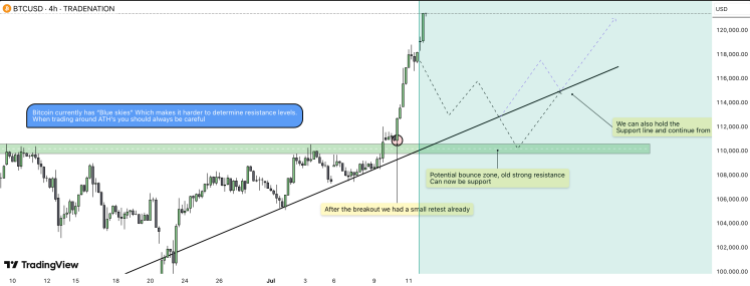
Should the price revisit such levels, a dip down to $110,000 is feasible, seeking to clear liquidity hotspots. However, this scenario could prove bullish if it results in a strong bounce, offering a more stable foundation for a sustainable move toward new highs beyond $125,000.
Bitcoin’s uptrend remains intact with ETF momentum
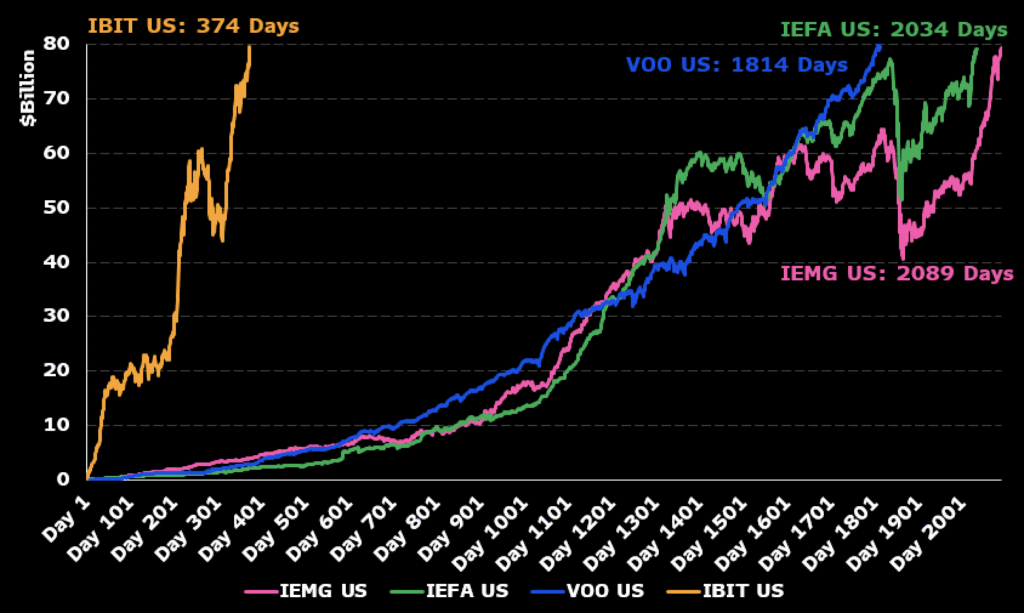
Institutional demand remains the pillar on which Bitcoin’s rally is supported. BlackRock’s spot Bitcoin ETF, IBIT, recently surpassed $83 billion in AUM, having tripled in 200 trading days. The ETF currently sits on more than 700,000 BTC, surpassing rivals and fortifying Bitcoin as an enduring institutional asset.
ETF analyst Eric Balchunas notes IBIT became the fastest fund to pass $80 billion, accomplishing the feat in just 374 days, far ahead of the record 1,814 days taken by $VOO. Such institutional fervor is a sign that the bull cycle is much further away, even amidst near-term sell-offs.
Long-term position metrics add further credence to bullish potential. The Ratio of Net Unrealized Profit/Loss is 0.69, below the 0.75 threshold associated with market highs. The market in the previous cycle remained above such a line for more than 220 days, but in the current cycle, it touched the line briefly, which still allows for further potential on the upside.