Cronos (CRO) is displaying resilience against broader market weakness, positioning itself for potential upside. Over the last 24 hours, the token gained nearly 1.36%, while its weekly chart reflects a 14.18% decline.
At the time of reporting, CRO trades at $0.2730 with a market capitalization of $9.1 billion. Its daily trading volume rose by 17.32% to $163.68 million, highlighting renewed market participation.
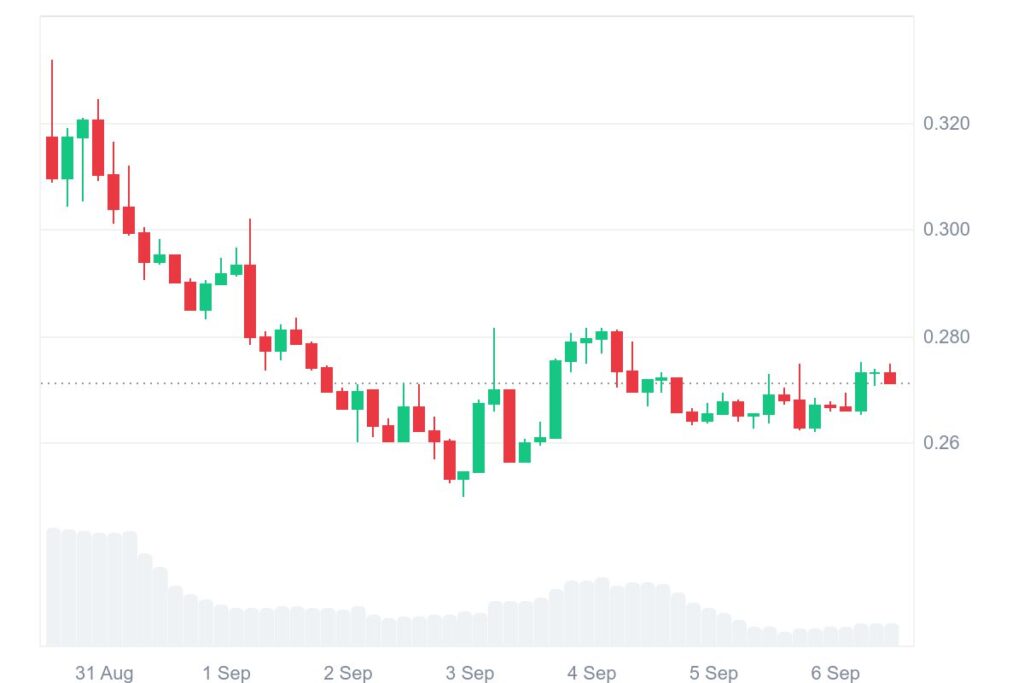
Earlier in the week, CRO briefly surged past the $0.30 mark, delivering one of its strongest performances in recent memory. However, a sharp rejection at that level pushed the price back below this barrier. Despite the retracement, the asset remains comfortably above its previous consolidation range, signaling growing investor confidence.
CRO technical levels shape market outlook
Chart analysis underscores the importance of the $0.24 level, which aligns with the mid-band of the Bollinger indicator. Holding this support could provide bulls with another chance to challenge the $0.30 resistance. A rebound from this area might extend the rally toward the $0.35–$0.36 zone. Conversely, failure to defend this level could trigger a drop into the $0.18–$0.15 range, a zone that previously attracted heavy buying interest.
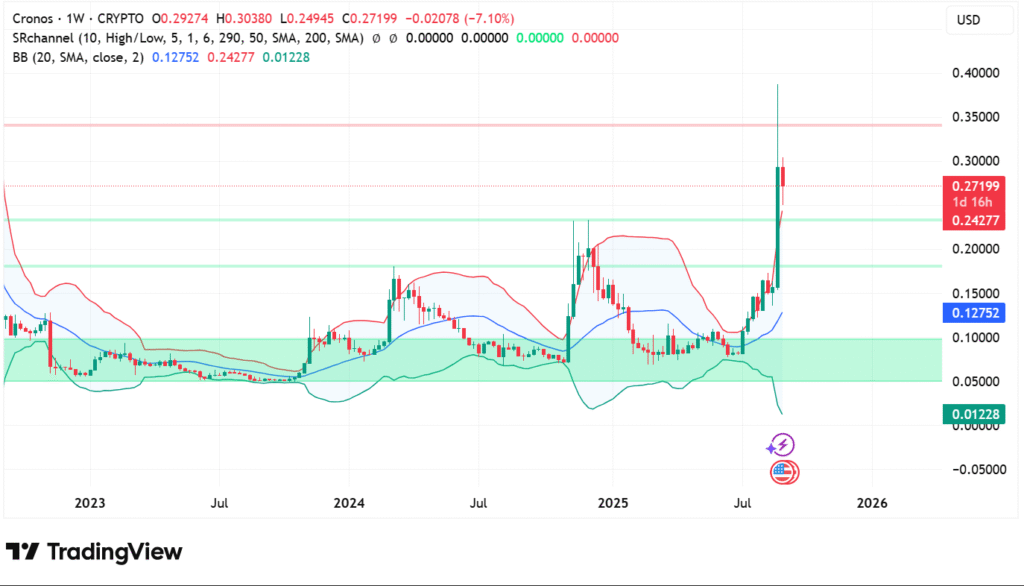
Momentum indicators also register a cooling down. The latest breakout pushed prices significantly above the Bollinger upper band, a setup most often observed before corrective consolidation. Long-wicked candlestick patterns portray energetic profit-taking but also consistent demand at lower price levels, characteristic of a tug-of-war among short sellers and long buyers.
Indicators reflect mixed but bullish momentum
CRO’s daily chart on a weekly scale suggests that currently the token is at 74.73 and thus is in overbought conditions. This verifies the strength of the bullish momentum but at the same time introduces the possibility of short-term wear. The slow indicator RSI at 57.65 indicates the speed of the burst.
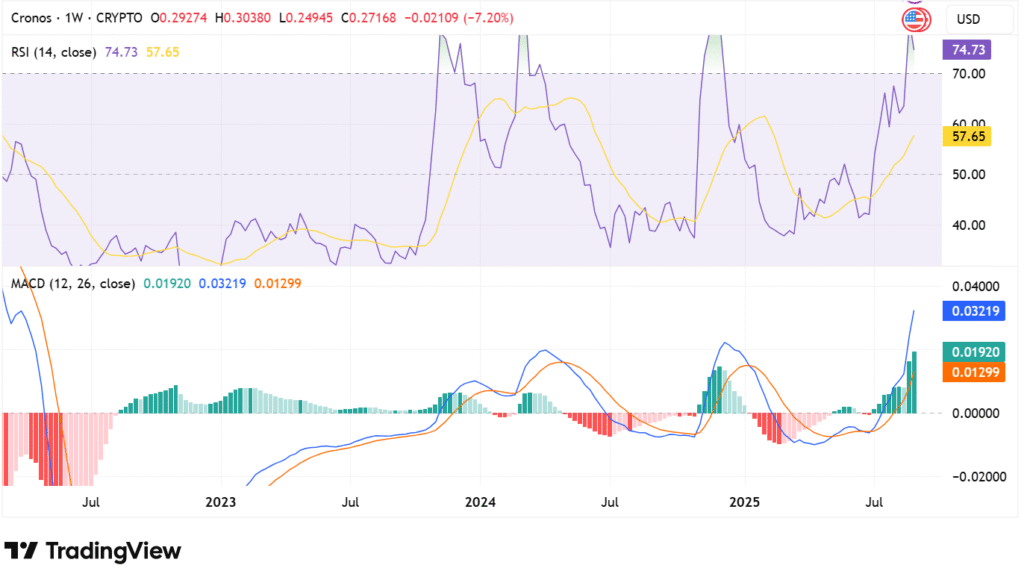
Meanwhile, the bullish picture is reinforced by the MACD. The MACD line at 0.03219 is also above the signal line at 0.01299, and expanding green histogram bars confirm persistent buying demand. With supporting level of $0.24 in place, the overall picture favors a continuation to $0.36, regardless of near-term declines causing temporary fluctuations.