Hedera stays strong even after the recent pullback. The market shows a falling wedge pattern, and traders usually see this as a sign of a coming trend change. Both technical signals and market mood show growing pressure for a possible move in price direction.
At the time of writing, HBAR is trading at $0.2195, up 1.64% in the past day. The market capitalization stands at $9.3 billion, with 42.39 billion tokens in circulation out of the 50 billion maximum supply. In the last 24 hours, trading volume dropped 40.26% to $121 million, showing weaker short-term activity.
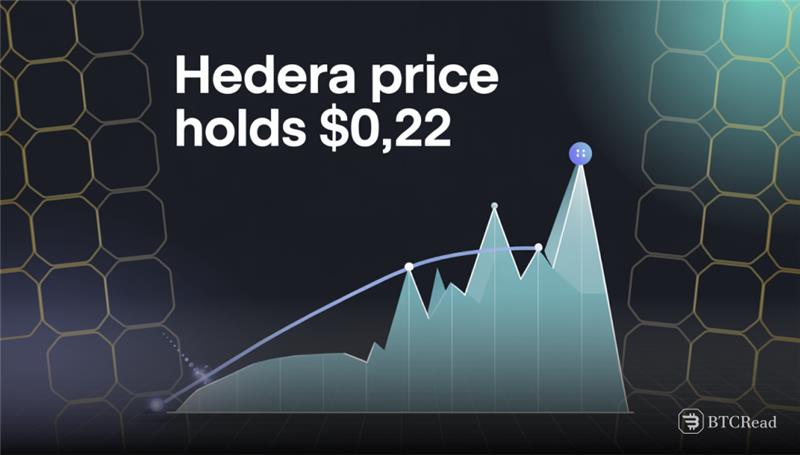
Accumulation around $0.22 strengthens support
Repeated defenses around $0.21–$0.22 highlight the area as a solid base. The price has cushioned declines here on multiple occasions and reduced bearish pressure. The area can potentially serve as a launchpad for an advance if sustained, while slides below $0.20 will challenge bullish optimism.
In a recent analysis, chart watchers noticed that a falling wedge pattern is slowing down the price movement. The resistance keeps moving lower, but the support level still holds. This tight setup looks similar to June, when Hedera broke higher after weeks of consolidation, adding strength to the current bullish structure.
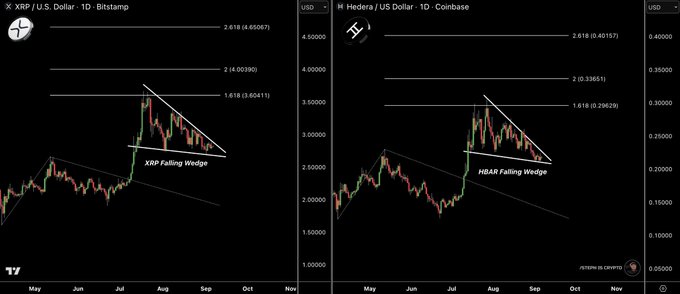
The next resistance levels are at $0.25, $0.29, and $0.33. If the price breaks above the wedge, it can boost bullish sentiment fast. Traders are watching the volume closely because higher activity usually appears before price increases in this pattern.
Hedera shows fading bearish momentum amid oversold conditions
The Relative Strength Index is at 40.63, which puts Hedera near oversold levels. If demand improves, the price could bounce higher. The current level shows the market is calming down after selling pressure, but investors stay cautious and look for stronger signals before making a move.
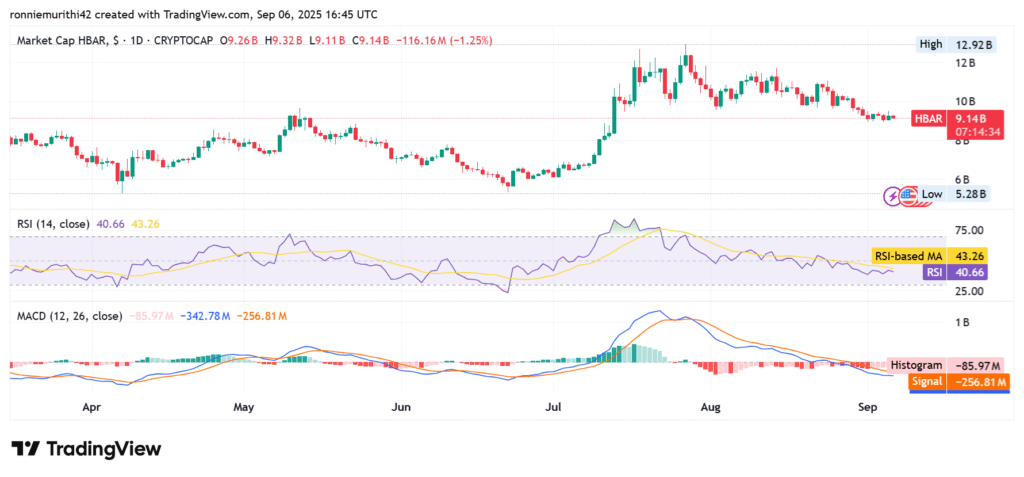
The MACD stays in the negative zone, with the histogram at -86.19M. Bearish pressure is still there, but the bars are flattening. Analysts see this as an early sign that downward momentum is fading, which could support the wedge breakout thesis.
If momentum holds and trading volume picks up, Hedera may break out of its current range into an uptrend. Traders view $0.20 as key support, with September’s direction hinging on a potential breakout.