


BNB is facing short-term pressure despite signs of renewed bullish momentum. A break above key resistance could support further gains, while holding the nearby support zone remains crucial. The broader Elliott Wave outlook suggests potential upside before another correction, with major technical levels guiding BNB’s next move.
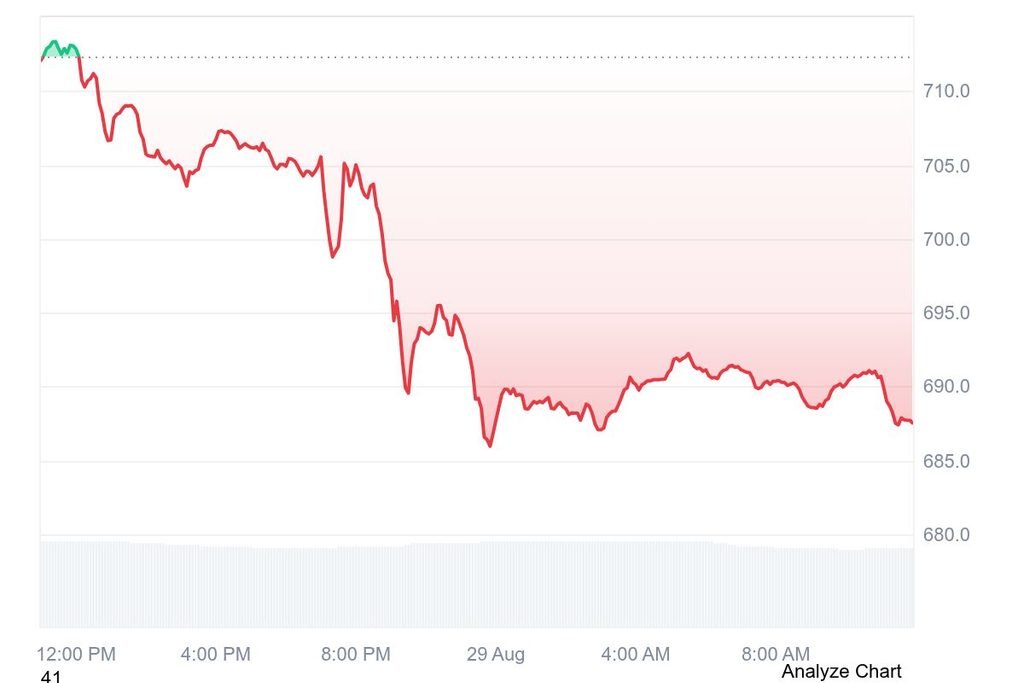
As of now, according to CoinMarketCap data, the token is trading at $687.54, with a decrease of 3.57% in the past 24 hours and down 1.71% over the past week.
BNB Eyes $725 Breakout as Bullish Momentum Strengthens
According to prominent crypto analyst Bitcoin Professor, BNB is showing renewed strength after climbing nearly 18% over the past week. The token has approached the $700 level, with bullish momentum placing the $710–$725 resistance zone in focus for its next potential move.
A breakout above $725 could strengthen the bullish structure and encourage buyers to push BNB toward higher levels. Such a move would indicate that bulls have overcome a major resistance area, potentially creating room for another upward move as market momentum continues to improve.
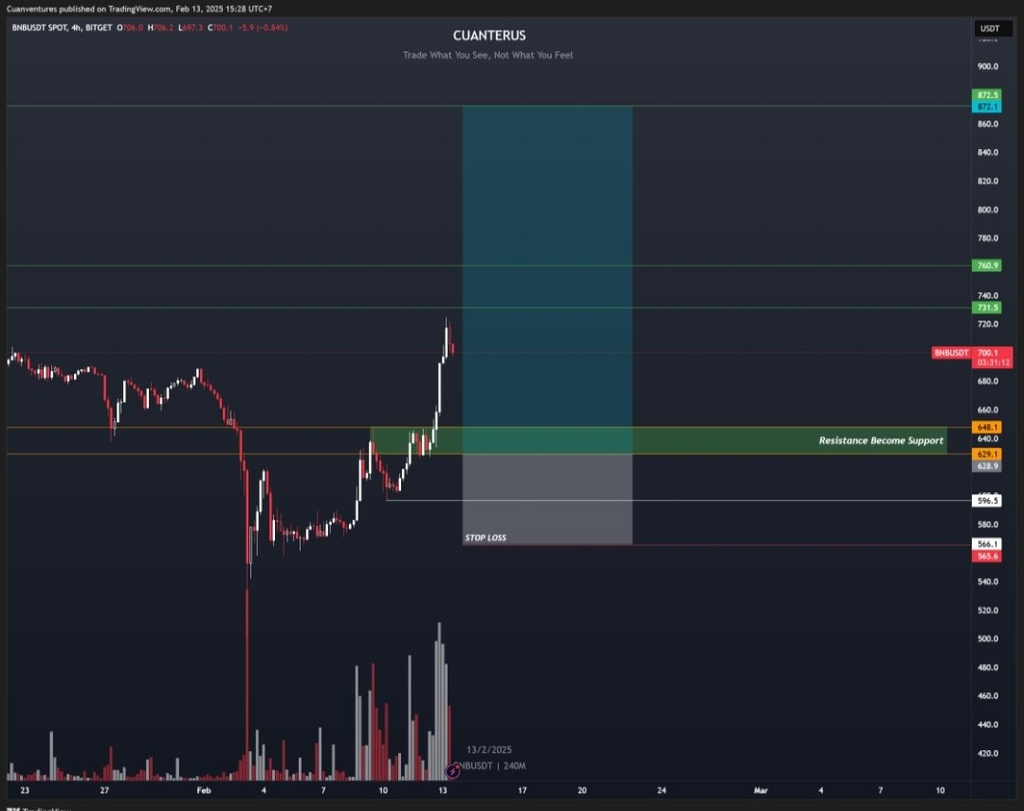
However, the $690–$695 region remains an important short-term support zone for BNB. Holding above this area could help preserve the current bullish momentum and allow buyers to make another attempt at the overhead resistance between $710 and $725.
If BNB loses the $690–$695 support zone, short-term momentum could weaken, and selling pressure may increase. At present, traders are closely watching whether buyers can defend support and eventually push BNB above $725, which could determine the token’s next major directional move.
Elliott Wave Setup Signals Potential BNB Recovery Ahead
The data from @finsends further highlighted that BNB may be forming a larger Elliott Wave correction after completing its previous five-wave advance. The setup suggests the recent decline could represent Wave A of a broader ABC correction rather than the end of BNB’s long-term bullish structure, despite the short-term focus on whether BNB can break above the $725 resistance.
The chart shows a potential Wave B recovery toward the $780 level, with the rebound possibly extending into the $900-$1,200 range. Such a move would represent a significant recovery and align with the analyst’s view that BNB could gain 20% to 70% before another decline begins.
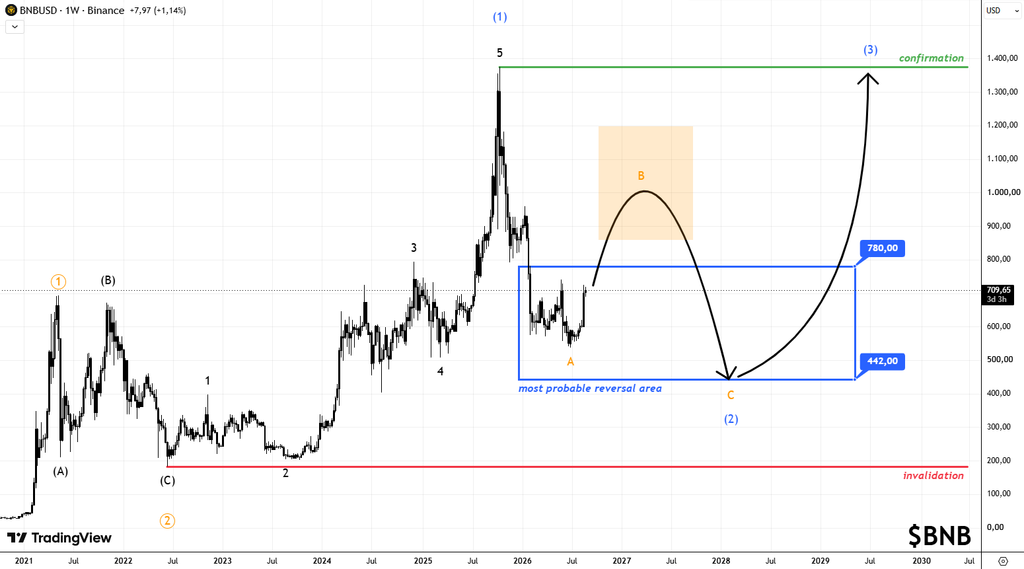
The projected $442-$780 range is highlighted as the most probable reversal zone. Wave C could potentially push BNB toward $442 before the next major bullish phase develops. However, the chart places structural invalidation around $180, making that level important for the longer-term Elliott Wave setup.
A sustained move above the previous $1,400 peak would provide stronger confirmation of the projected Wave 3. If BNB successfully breaks above that resistance after completing the correction, the cryptocurrency could enter another powerful bullish phase.