
BONK surged 25% in the last 24 hours and climbed 75% over the past week. It reached a daily high of $0.00003936 and trades modestly lower at the current time. The upsurge has attracted serious market attention as investors believe more gains are likely.
BONK’s current price was 33% below the all-time high of $0.00005916 today, according to CoinMarketCap. The trading volume rose 60% in one day, to $2.4 billion. The surge boosted the price of BONK’s market cap to more than $3 billion, suggesting more investor interest.
Coinglass show that the amount of derivatives grew 150% as Open Interest rose 36%. It shows increased exposure of the traders to BONK. Meanwhile, short sellers faced 24-hour liquidations of $3.39 million, which gave a bullish boost to the rally.
BONK has just overcome a long-standing downtrendline and horizontal resistance at approximately $0.00003. Upon successful support retest, the price now moves up towards a zone of supply at approximately $0.000037, which still has a strong uptrend setup.
BONK targets $0.00004676 after breakout
Cryptocurrency analyst Professor Moriarty highlighted BONK’s chart breakout from last week. The coin managed to break through resistance and remain above it, up 49% since the previous analysis. The next major resistance level is crucial for the uptrend to keep going.
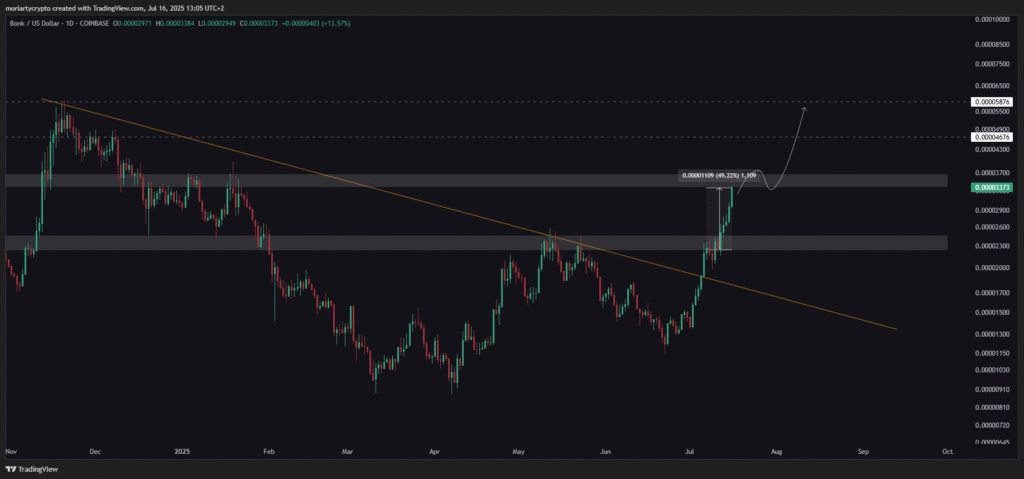
BONK reaches a price zone capping gains at the end of 2024. On volume, breaking through the area would see the next levels at $0.00004676 and then at $0.00005876. These are the previous swing highs and can be used as short-term targets.
In the 4-hour chart, BONK had a textbook bullish breakout supported by volume. It broke the 3.618 Fibonacci level at $0.00003894 and is close to the 4.236 extension at $0.00004190—the so-called “golden pocket”, a favorite take-profit zone.
Momentum indicators support the uptrend. The RSI is at 78.31, supporting the strong bullish momentum as well as the overbought condition. The MACD shows widening histogram bars above the signal line, whereas the Ultimate Oscillator remains above 66, confirming the strength.
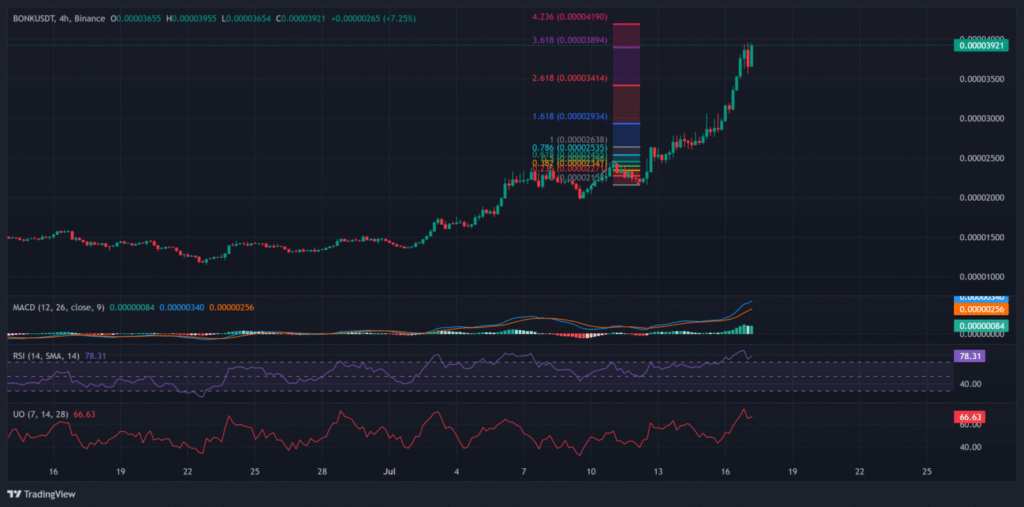
If BONK were to break through the $0.00004190 Fib level, it could retest the all-time high of $0.00005916. A rejection at this level can lead to a retracement to the 3.618 or 2.618 Fibonacci levels at $0.00003894 or $0.00003414, respectively, as potential areas of support.